Angus Ferraro

A tiny soapbox for a climate researcher.


2 Comments

Can stratospheric aerosols directly affect global precipitation?

What is the effect of stratospheric aerosol geoengineering on global precipitation? If we were to inject sulphate aerosol into the stratosphere it would reflect some sunlight and cool the Earth, but the atmosphere’s CO2 levels would remain high. This is important, because CO2 actually has an effect on precipitation even when it doesn’t affect surface temperature. In a recent paper with a summer student, I’ve shown the aerosols can contribute a similar effect.
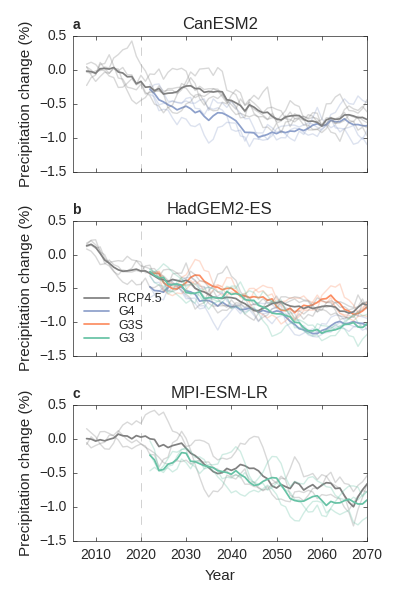
Three climate models (CanESM2, HadGEM2-ES, MPI-ESM-LR) did simulations of the future with and without geoengineering. The simulations with stratospheric aerosols (G3 and G4) show greater temperature-independent precipitation reductions than the simulations without them (RCP4.5 and G3S).

Three climate models (CanESM2, HadGEM2-ES, MPI-ESM-LR) did simulations of the future with and without geoengineering. The simulations with stratospheric aerosols (G3 and G4) show greater temperature-independent precipitation reductions than the simulations without them (RCP4.5 and G3S).

Precipitation as energy flow

Precipitation transfers energy from the Earth’s surface to its atmosphere. It takes energy to evaporate water from the surface. Just as evaporation of sweat from your skin cools you off by taking up heat from your skin, evaporation from the Earth’s surface cools it through energy transfer. Precipitation occurs when this water condenses out in the atmosphere. Condensation releases the heat energy stored when the water evaporated, warming the atmosphere. Globally, precipitation transfers about 78 Watts per square metre of energy from the surface to the atmosphere. Multiplying that by global surface area that’s a total energy transfer of about 40 petajoules (that’s 40 with 15 zeros after it) of energy every second! To put that in a bit of context, it’s about 40% of the amount of energy the Sun transfers to the Earth’s surface.

If precipitation changes, that’s the same as saying the atmospheric energy balance changes. If we warm the atmosphere up, it is able to radiate more energy (following the Stefan-Boltzmann law). To balance that, more energy needs to go into the atmosphere. This happens through precipitation changes.

Direct effects of gases on precipitation

Now imagine we change the amount of CO2 in the atmosphere. This decreases the amount of energy the atmosphere emits to space, meaning the atmosphere has more energy coming in than out. To restore balance the atmospheric heating from precipitation goes down. This means that the global precipitation response to global warming from increasing CO2 has two opposing components: a temperature-independent effect of the CO2, which decreases precipitation, and a temperature-dependent effect which arises from the warming the CO2 subsequently causes. In the long run the temperature-dependent effect is larger. Global warming will increase global precipitation – although there could be local increases or decreases.

But what happens if we do geoengineering? Say we get rid of the temperature-dependent part using aerosols to reduce incoming solar radiation. The temperature-independent effect of CO2 remains and global precipitation will go down.

Detecting the effect of stratospheric aerosol

CO2 isn’t the only thing that has a temperature-independent effect. Any substance that modifies the energy balance of the atmosphere has one. In our new study, we ask whether stratospheric sulphate aerosol has a detectable effect on global precipitation. Theoretically it makes sense, but it is difficult to detect because usually there are temperature-dependent effects obscuring it.

We used a common method to remove the temperature-dependent effect. We calculated the precipitation change for a given surface temperature change from a separate simulation, then used this to remove the temperature-dependent effect in climate model simulations of the future. We did this for future scenarios with and without geoengineering.

As expected, we found a temperature-independent influence which reduced precipitation. Importantly, this effect was bigger when geoengineering aerosols were present in the stratosphere. This was detectable in three different climate models. The figure above shows this. The non-geoengineered ‘RCP4.5’ simulation shows a precipitation decline when the temperature effect is removed. This comes mainly from the CO2.  The ‘G3’ and ‘G4’ geoengineering simulations (blue and green lines) have an even greater decline. The aerosol is acting to decrease precipitation further.

How does aerosol affect precipitation?

The temperature-independent effect wasn’t present when geoengineering was done by ‘dimming the Sun’. The ‘G3S’ simulation  (orange lines in the figure) does this, and it has a similar precipitation change to RCP4.5. So what causes the precipitation reduction when stratospheric aerosols are used? We calculated the effect of the aerosol on the energy budget of the troposphere (where the precipitation occurs). We separated this in two: the aerosol itself, and the stratospheric warming that occurs because of the effect of the aerosol on the stratosphere’s energy budget.
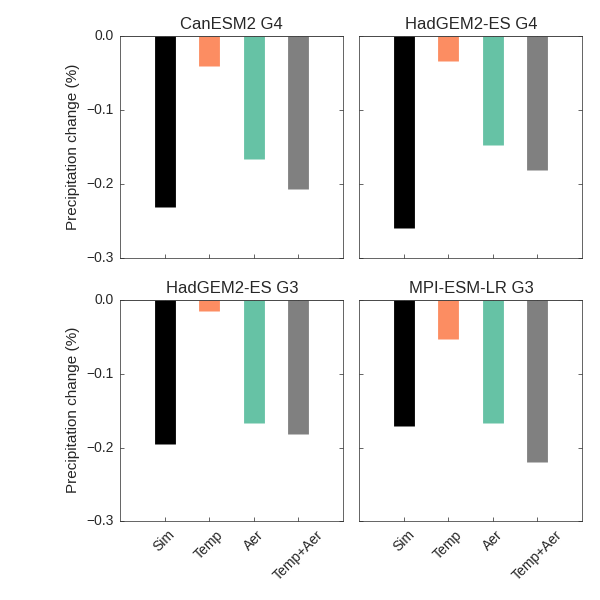
Black bars show the temperature-independent precipitation changes simulated by the models. Orange bars show our calculation of the effect of the stratospheric warming. Green bars show our calculation of effect of the aerosol itself. Grey bars show our calculation of the total effect, which is very close to the actual simulated result.

Black bars show the temperature-independent precipitation changes simulated by the models. Orange bars show our calculation of the effect of the stratospheric warming. Green bars show our calculation of effect of the aerosol itself. Grey bars show our calculation of the total effect, which is very close to the actual simulated result.

We found the main effect was from the aerosol itself. The aerosol’s main effect is to reduce incoming solar radiation and cool the surface. But we showed it also interferes a little with the radiation escaping to space, and this alters the energy balance of the troposphere. The precipitation has to respond to these energy balance changes.

This effect is not huge. We had to use many model simulations of the 21st Century to detect it above the ‘noise’ of internal variability. In the real world we only have one ‘simulation’, so this implies the temperature-independent effect of stratospheric aerosol on precipitation would not be detectable in real-world moderate geoengineering scenario. This also means climate model simulations not including the effects of the aerosol could capture much of the effects of geoengineering on the global hydrological cycle.

This effect could be more important under certain circumstances. If geoengineering was more extreme, with more aerosol injected for longer, precipitation would decrease more. But, based on these results, the main effect of geoengineering on precipitation is that the temperature-dependent changes are minimised. This means the temperature-independent effect of increasing CO2 concentrations is unmasked, reducing precipitation.

Take a look at the paper for more details – it’s open access!

Ferraro, A. J., & Griffiths, H. G. (2016). Quantifying the temperature-independent effect of stratospheric aerosol geoengineering on global-mean precipitation in a multi- model ensemble. Environmental Research Letters, 11, 034012. doi:10.1088/1748-9326/11/3/034012.


On a personal note, this paper is significant because it is the culmination of the first research project I truly led.  Of course I managed my own research as a PhD student and post-doc, but my supervisors secured the funding. They also acted as collaborators. Here I came up with the idea, applied for funding, supervised Hannah (the excellent student who did much of the analysis) and wrote up the results. It’s a milestone on the way to becoming an independent scientific researcher. For this reason this work will always be special to me. Thanks also to Hannah for being such a good student!

Leave a comment

A physically consistent view of changes in the tropical atmosphere in response to global warming

What determines how much global warming we are going to see? In the long term it all comes down to feedbacks – changes in the climate system in response to warming which act to strengthen or weaken the eventual total warming. I have a new paper out in Journal of Climate with co-authors Hugo Lambert, Mat Collins and Georgina Miles looking at two of the main climate feedbacks in satellite observations and climate models.

One of the main feedbacks is the positive water vapour feedback, which comes about because a warmer atmosphere holds more water vapour, a greenhouse gas, which amplifies the warming. In climate models, a strong positive water vapour feedback is usually associated with a strong negative lapse rate feedback (which arises because the atmosphere warms faster than the surface). This means that models agree more on the size of the combination of these two feedbacks than they do on the size of the individual components.

We can imagine why the water vapour and lapse rate feedbacks would oppose each other. The water vapour feedback happens because atmospheric specific humidity increases with warming. The humidity of the upper troposphere is especially important for controlling the amount of radiation the Earth emits to space. If upper tropospheric humidity increases, the amount of radiation emitted to space goes down and the Earth warms up.

Now, atmospheric humidity is controlled by transfer of water from the surface, so generally any water vapour in the atmosphere must have got there by condensation. Since condensation releases heat, increasing humidity must generally be accompanied by atmospheric warming. This physical picture is especially appropriate for the Tropics, where convective storms provide the main pathway for water to get into the upper troposphere. Isaac Held has a number of posts on this topic on his blog – for example, this introduction to the concept of the moist adiabat. Outside the Tropics convection doesn’t link the upper troposphere so strongly to the surface, so the picture becomes a little more complex.

The question is: do the water vapour and lapse rate feedbacks oppose each other on a regional basis as well as a global basis?

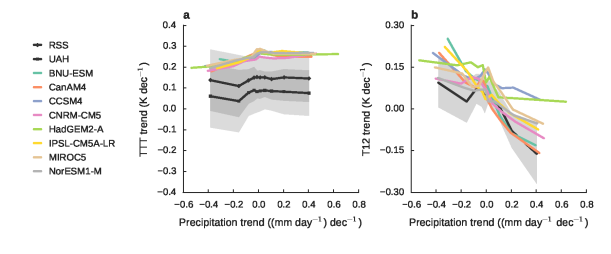
Modelled and observed changes in HIRS Channel 12 brightness temperature (a proxy for upper-tropospheric humidity) as a function of precipitation trend.

Figure 1. Regional modelled and observed changes in tropical HIRS Channel 12 brightness temperature (a proxy for upper-tropospheric humidity) as a function of precipitation trend.

Observing climate feedbacks

In climate models it is possible to calculate feedbacks quite accurately. This involves running a radiative transfer calculation on the atmospheric properties from a present-day model simulation, then swapping in the atmospheric properties of interest from a warmer climate. For example, for the water vapour feedback we should change just the water vapour content of the atmosphere and use the radiative transfer calculation to look at what it does to the outgoing radiation. This procedure can’t really be done with observations because we can’t observe the warmer climate! There are also complications in working out what the observed atmospheric properties are. Satellites can help, but they measure radiation, not the atmospheric properties directly, so we have to introduce a modelling step to derive them. These so-called ‘retrievals’ can in some cases be very accurate, but the additional calculation introduces some uncertainty into the analysis.

Nevertheless, using this technique we can observe the water vapour feedback associated with year-to-year variations in atmospheric humidity, but we then have to take care drawing links between these variations and the potential feedback associated with long-term global warming. Gordon et al (2013) found that the water vapour feedback in response to short-term variations was less than that in response to long-term global warming.

We took a different approach in our paper. Rather than look at variations in the climate system we looked at 30-year trends over some of our longest-running satellite observations. For upper-tropospheric humidity, we looked at the brightness temperature at a wavelength of about 6.7 microns, as measured by the High-resolution Infrared Sounder (HIRS). This corresponds to the amount of outgoing radiation at the centre of one of the absorption bands of water vapour. For upper-tropospheric temperature, we looked at the microwave emissions as measured by the Microwave Sounding Unit (MSU). Rather than trying to use these data sources to derive the atmospheric properties to compare with climate models, we instead calculated what these observations would look like if climate models were real. One can do this using radiative transfer calculations that have been shown to be quite accurate.

We then looked at the observed changes in these two quantities and compared them with the corresponding changes in climate model simulations. Since we were interested in specifically the behaviour of the atmosphere, we used model simulations in which sea surface temperatures were fixed to observations for the period 1979-2009. This means we can be sure any differences we see among models are to do with the simulation of the atmosphere, not the ocean.

What we found was that the atmospheric warming over the past 30 years has been fairly uniform across the Tropics (Figure 1a). This is because, in this part of the world, the Earth is rotating quite slowly and is unable to maintain strong temperature gradients. To borrow an analogy from Isaac Held, you can think of this as being like a tank of water unable to maintain a higher level in the centre than at the edges. If the tank was rotating it would be able to do so (this is more like the situation near the poles). Recalling that the lapse rate feedback is basically to do with the difference in the rate of warming of the surface and the atmosphere, this means that the regional pattern of the lapse rate feedback would be mainly determined by the regional pattern of the surface temperature changes.

On the other hand, we found that the pattern of changing atmospheric humidity was quite variable (Figure 1b). Unsurprisingly, in the Tropics this is strongly related to precipitation, since the convective storms that moisten the upper troposphere also produce rainfall.

Bringing the evidence together

These two patterns are quite well reproduced among climate models, which is nice to see. They are doing what we physically expect, but this result spawns another question.

Tropical precipitation changes under global warming can be thought of as a combination of two effects. First, a warmer atmosphere holding more water means that convective storms tend to rain more. Second, the pattern of surface warming tends to shift the regions in which convective storms happen. If the water vapour feedback’s regional pattern is related to precipitation, which of these two effects matters more? We used climate model simulations to answer this question to take advantage of the additional detail they provide.

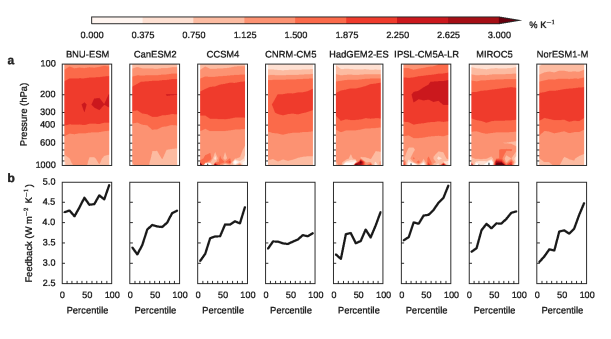
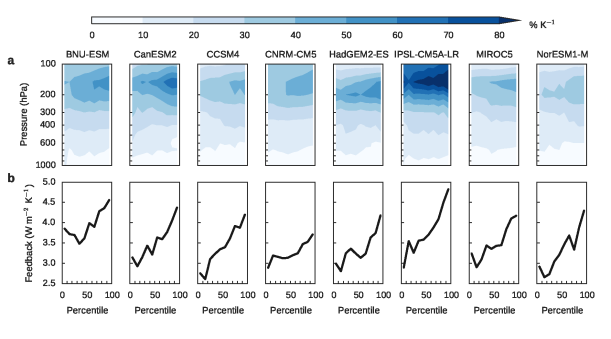
We found that, even when we accounted for the shifting convective storms, the pattern of strong atmospheric humidity increases in the regions of the greatest increases in rainfall persisted. Crucially, after accounting for the shifts, we found there was some relationship between the water vapour and lapse rate feedbacks on a regional scale, just as we saw on the global scale. A strong positive water vapour feedback is associated with a strong negative lapse rate feedback (compare Figure 2b with Figure 3b below).

Now we have a coherent picture emerging. There is no relationship between the water vapour and lapse rate feedbacks on a regional basis, in spite of the relationship on global basis, because atmospheric temperature changes get ‘mixed out’ horizontally much more than humidity changes. However, if we remove the effects of shifting precipitation patterns on the feedbacks, a relationship starts to emerge. The relationship is not strong, indicating the fundamental difference in horizontal mixing is still having an effect, but it is there. Climate models reproduce these patterns in a similar manner to the observations we looked at.

hus_percentiles

Figure 2. (a) Modelled changes in atmospheric specific humidity in response to a quadrupling of CO2 concentrations. (b) Modelled water vapour feedback. Data are presented in percentiles of precipitation with the regions of heaviest precipitation on the right.

ta_percentiles

Figure 3. (a) Modelled changes in atmospheric temperature in response to a quadrupling of CO2 concentrations. (b) Modelled lapse rate feedback. Data are presented in percentiles of precipitation with the regions of heaviest precipitation on the right.

These results are not a particularly stringent test of climate models. The relevant physics are quite simple so it would be a huge surprise if they did not behave in this manner. However, our research is still useful because it indicates the models do behave in physically sensible ways and that we can use them to explain the regional distribution of the water vapour and lapse rate feedbacks.

We also asked whether a model’s representation of these feedback patterns tells us anything about the total strength of these feedbacks – in other words, how much global warming we might see for a given increase in carbon dioxide concentrations. Unfortunately, we didn’t see a relationship here. This might be because we only used eight climate models in our investigation, but it might also be that there is no physical link between the two things.


Ferraro AJ, FH Lambert, M Collins and GM Miles (2015), Physical Mechanisms of Tropical Climate Feedbacks Investigated using Temperature and Moisture Trends, J. Clim, doi:10.1175/JCLI-D-15-0253.1.


Leave a comment

Stratospheric aerosol geoengineering and the polar vortex

Geoengineering by reducing the amount of solar radiation the Earth absorbs has become a hot topic in the last few years. Of all the impacts geoengineering might have on our climate, why on earth should we care about what goes on in the stratosphere, 10 kilometres above our heads? It turns out what goes on up there has a substantial impact on what goes on down here.

This is the subject of the final paper (open access!) from my PhD work with Andrew Charlton-Perez and Ellie Highwood, at the University of Reading. In it we ask what effect stratospheric aerosol geoengineering might have on the stratosphere, and how those effects might be communicated to the troposphere below.

We used some idealised simulations with a climate model to investigate, placing a layer of aerosol in the model’s stratosphere. Since we don’t know exactly how geoengineering might turn out, we had to make some simplifying assumptions about the size of the aerosol particles and the shape of the aerosol cloud. Not all of these were realistic, so it’s important to think about how our results might be affected if these assumptions changed. That’s a rule that holds true for all science, of course.

ferraro2015_fig4

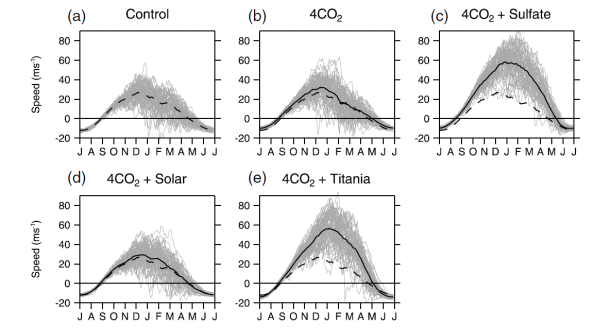
Strength of the polar vortex as measured by winds at 60N, 10 hPa. Each grey line shows the wind speed over 1 year. The mean of the Control simulation is shown by the dashed black lines. The means from the other simulations are shown by solid black lines.

In our model simulations we compared three different potential deployments of geoengineering. One used sulphate aerosol, mimicking the effect of natural sulphate aerosols produced by volcanic eruptions. Another used titania (titanium dioxide) aerosol, which is much more reflective than sulphate and may do less damage to the ozone layer. Finally, we looked at the case where geoengineering was represented by simply dimming the Sun. In practice this could only be achieved using mirrors placed in space, but it has also been used as a representation of geoengineering with stratospheric aerosols.

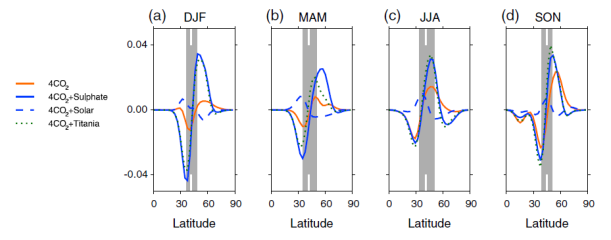
We found that the aerosols intensified the stratospheric polar vortex by warming the tropical stratosphere. The polar vortex is linked to the midlatitude jet streams in the troposphere, which act as guides for weather systems. As the polar vortex gets stronger the jet streams tend to shift further poleward. This would obviously have an effect on the meteorology of a geoengineered world. The jet streams would still wobble and meander about all over the place, but on average they would be located closer to the poles, changing which regions experience the strongest storms and most rainfall.

The link between the stratospheric polar vortex and the jet streams is extremely well documented, and reproduced by models. There is, however, still quite a lot of debate over exactly how the two things are linked, and the extent to which models get it right. For example, the polar vortex intensifies in response to volcanic eruptions, just like it does in simulations of geoengineering, but climate models don’t simulate very well the shifting of the jet streams associated with it.

ferraro2015_fig5

Changes in probability density function of North Atlantic jet latitude in (a) December-January-February, (b) March-April-May, (c) June-July-August, and (d) September-October-November. Grey shading shows the interquartile range of the Control simulation with the median marked with a white bar.

That said, the shifting of the jet streams under stratospheric aerosol geoengineering should be fairly robust. Stratospheric aerosols are known to intensify the polar vortex. This is because they absorb thermal radiation in the tropics (where they get energy from the warm troposphere below) more than they do at the poles (where the underlying troposphere is colder). This temperature gradient sets up a pressure gradient, intensifying the westerly winds of the polar vortex.

The jet streams will shift in response to this, although exactly how, or how much, is open to question. Those are the questions that are more important to answer.

Unfortunately, our study can’t really help with that, for two main reasons.

The first is that we used a single climate model, which means we can’t generalise our results. In order to test the robustness of our results, we would need to look at a number of different models, with different representations of the dynamics of the atmosphere. We also didn’t delve deeply into the theory behind the linkage between the polar vortex and the jets. This is because the science of stratosphere-troposphere coupling is still rather mysterious, and attempting to come up with a theory explaining it is a huge task.

The second reason we can’t use our results to make predictions is that our representation of geoengineering wasn’t particularly realistic. We placed a huge amount of aerosol into the model. In our set up we could put as much in as we wanted because the aerosol particles don’t interact with the atmospheric circulation, or each other. In model simulations where these interactions are allowed, large aerosol injections caused the aerosols to stick together, grow, and fall out of the stratosphere rather quickly. This means it might not even be possible to put such huge amounts of aerosol into the stratosphere.

Whether it would be or not would depend on the degree to which the aerosols stick together. This process would occur differently for different aerosols. For example, sulphate aerosols are liquid and coagulate quite easily. Titania is a solid ‘dust’-type aerosol, which might be more resistant to this. More research is needed on this, though. As far as I am aware no one has done any simulations of how titania might actually behave in the stratosphere.

Another important caveat to our results is that our model didn’t include the effects of the aerosol on stratospheric ozone. As well as it’s important role in blocking UV radiation, ozone affects stratospheric temperatures. Other studies have shown stratospheric aerosol geoengineering would reduce ozone at higher latitudes, cooling the polar stratosphere. This effect would further enhance the intensification of the polar vortices.

So there are a number of reasons we should take care in interpreting our results. The central message, though, is that stratospheric aerosols influence the midlatitude jets, and they do this via polar vortex changes caused by absorption of radiation by the aerosol particles. If an aerosol that didn’t absorb as much was used these effects could be reduced. This is one of the reasons titania is being investigated as a geoengineering aerosol. Titania reflects more radiation than sulphate and absorbs less, meaning one could accomplish the same surface cooling with less aerosol, and have a smaller impact on the midlatitude jets. If we found an aerosol that didn’t absorb radiation at all (not really likely) we would essentially have a very similar case to our solar dimming simulation, which shows very minimal jet shifts.

Finally, it’s important to emphasise this is all hypothetical. I see research like this as part of an effort to understand what stratospheric aerosol geoengineering is. What are the potential risks as well as the potential benefits? This is the first step in understanding geoengineering as a policy option, but it is not the last. There are plenty of potential problems with geoengineering to do with issues of justice, conflict and ultimately, the human relationship with the natural world.


2 Comments

EUMETSAT Conference 2014: Socioeconomic benefits of meteorological satellites

Globally, governments spend about $10 billion on meteorological satellites every year. That’s a lot of money. How do we know it’s worth it?

Yesterday night the EUMETSAT conference branched off to the WMO for a side-event asking that very question. I was impressed by the rigour of their calculations, but also by the thoughtful responses to the question of how this information should – and should not – be used.

Alain Ratier, Director of EUMETSAT, presented the results of a comprehensive activity aiming at calculating the benefit-cost ratio to the EU of polar-orbiting meteorological satellites. The cost of these things is relatively easy to estimate, but the benefits are a little more difficult. They approached the problem in two steps: first, what is the economic benefit derived from weather forecasts? Second, what impact do meteorological satellites have on weather forecast skill?

The resulting report contains some fascinating facts and figures. It has been estimated that as much as one third of the EU’s GDP is ‘weather-sensitive’. Of course, this isn’t the same as ‘weather forecast sensitive’, but it at least gives a sense of potential vulnerability. The report concluded that the total benefit of weather forecasts to the EU was just over €60 billion per year. Most of that comes in the form of ‘added value to the European economy’ (broadly, use of weather information to help manage transport networks, electricity generation, agricultural activities, and so on), but there are also contributions from protection of property and the value of private use by citizens.

Compared to the calculation of the economic benefits of weather forecasts, the calculation of the effects of satellite data on those forecasts is quite straightforward. One can assess this by ‘suppressing’ source of data in our weather forecasts. Forecasts proceed by using a numerical model of atmospheric physics to predict the future atmospheric state. Since weather prediction is a chaotic problem, it’s important we start the forecast from as close as possible a representation of the real atmospheric state. This is called initialisation and it’s absolutely crucial to weather forecasting.  In order to calculate the effects of satellite information, we can simply exclude satellites from the initialisation phase of the weather prediction.

(left) 5-day forecast for Superstorm Sandy, (middle) the forecast without polar-orbiting satellite data and (right) the actual conditions that occurred. Credit: ECMWF.

The results are quite astounding. Satellite data contributes 64% of the effect of initialisation in improving 24-hour forecasts (the other 36% comes from in-situ observations). This approach reveals that measurements from a single satellite, the EUMETSAT MetOp-A, accounts for nearly 25% of all the improvement in 24-hour forecast accuracy derived from observations. MetOp-A is a relatively new platform, indicating that recent advances are providing huge benefits to weather forecasts.

The impact of satellite observations is vividly illustrated by considering 5-day forecasts of the track of Superstorm Sandy made with and without satellite initialisation. Without the use of polar-orbiting satellites, forecasters would not have predicted that the storm would make landfall on the Western US coast. As it was, the 5-day forecast of the storm track was remarkably close to reality, allowing forecasters to issue warnings of imminent risk of high winds and flooding.

The conclusion is that meteorological satellites provide benefits that outweigh their costs by a factor of 20. This is a conservative estimate in which high-end cost estimates have been compared with low-end benefit estimates. One reason we might expect benefit estimates to be low is that private companies are often reluctant to reveal how they use weather forecasts, either because this information is commercially sensitive or because they risk being charged more for the forecast data they receive!

It’s important to consider the limits of this approach. The obvious one is that cost-benefit estimates do not include the number of human lives that have been saved by weather forecasts. Not only is this difficult to calculate, it’s also impossible to put an economic value to. It would be very interesting to see if the toolbox of social science research has some methods to assess the ‘social’ part of the ‘socioeconomic’ benefits, moving away from attaching monetary value to things and considering those benefits which aren’t as easy to quantify. This doesn’t have to mean human life; any non-monetary social benefit of weather forecasting could be considered.

I think this is especially valuable because it’s questionable whether the cost-benefit approach is truly appropriate. Cost-benefit analyses frame things in a certain way; the WMO and EUMETSAT representatives at the meeting were well aware of this. They may imply greater certainty than is appropriate, and they may encourage a naively quantitative approach to what is fundamentally a qualitative problem: is it for better or for worse that we have meteorological satellites? Answering such a question involves some value judgements simple quantitative approach can gloss over. As LP Riishøjgaard pointed out, although we can make this kind of cost-benefit estimate ‘frighteningly’ easily, it’s not obvious that we should.

EUMETSAT Post 1: Challenges and advances in satellite measurement.

EUMETSAT Post 3: Final highlights.


Leave a comment

Trade-offs between biofuels, pollution and human health

I came across a fascinating news item on Twitter the other day, publicising a paper  (Ashworth et al. 2013) about the effects of certain biofuel crops on air quality. This isn’t my area of expertise at all (assuming I have expertise, that is!) but I found it an excellent example of the trade-offs humans make in their interventions in the environment. In densely-populated and highly-industrialised Europe, where this study is focused, there is no such thing as ‘nature’ or the ‘natural environment’. Human and natural systems are intertwined. The study demonstrates how complex this relationship is.

Poplar – potential biofuel crop (C) di bo di

Isoprene emissions from woody biofuels impact human health

In a nutshell, the study showed that replacing crops or grassland with woody biofuel crops like ash, poplar and willow (which they call ‘short rotation coppice’) increases concentrations of a chemical called isoprene in the atmosphere. The vast majority of the isoprene in the atmosphere comes from plants. Isoprene is quite reactive and reacts with other chemicals in the atmosphere. If there is a lot of nitric oxide pollution around, isoprene reacts with it and forms ozone. Ozone is very important for shielding the Earth’s surface from harmful solar ultra-violet radiation, but it is best kept high in the atmosphere because it is also harmful to human health.

Nitric oxide and isoprene, therefore, is a bad mixture to have in the atmosphere. The resulting ozone is linked to asthma, bronchitis and heart attacks. Planting 72 million hectares of biofuel crops across Europe, the study estimated the isoprene-related ozone could cause between 690 and 1,890 additional deaths each year. Ozone is also harmful to crop growth, and they estimated crop losses with a value of $1-2bn (in 2010 dollars).

Other effects of isoprene

Isoprene is also implicated in the formation of secondary organic aerosol. These are tiny particles (‘aerosols’) which both absorb and reflect solar radiation. Most aerosols (except very sooty ones) tend to be more reflective, which means they cool the surface. A cloud of aerosols works much like a cloud of water droplets in this sense, providing a sunshade. These aerosols are ‘organic’ because they come from compounds produced by plants, and ‘secondary’ because these compounds first have to undergo some chemical reactions in the atmosphere before the aerosols are produced.

Secondary organic aerosols are still quite poorly understood and offer plenty of interesting research opportunities. We don’t even understand whether isoprene always increases the amount of secondary organic aerosol or whether it sometimes decreases it.

Choose your biofuel crops carefully

In my research for this post I came across another paper (Crespo et al. 2013) which looked at emissions of isoprene (and other so-called ‘volatile organic compounds’) from different types of biofuel crops. They showed that the problem of isoprene emissions is much bigger for woody crops, such as the ones used in the Ashworth study I mentioned earlier. Most plants emit isoprene but some do so much more than others.

[O]ur data suggest that the use of perennial grasses for extensive growing for biofuel production have lower emissions than woody species, which might be important for regional atmospheric chemistry.

The ‘perennial grasses’ they study are things like ‘elephant grass’, a fast-growing crop which is already being grown in the UK.

I find the interplay between the ‘natural’ and the ‘human’ especially interesting here. Humans may think they are doing something natural (or at least modifying the environment is a sympathetic way) by planting these crops. The ‘natural’ isoprene emissions combine with human pollution (nitric oxide) and produce ozone pollution, which affects human health, crop yields and ‘natural’ plant growth.


Leave a comment

Paper review: Stratospheric versus tropospheric control of the strength and structure of the Brewer-Dobson circulation

Citation: Gerber, Edwin P., 2012: Stratospheric versus Tropospheric Control of the Strength and Structure of the Brewer–Dobson Circulation. J. Atmos. Sci., 69, 2857–2877.
[pdf] from Edwin Gerber’s web page

The stratosphere lies above the troposphere (which is where most ‘weather’ happens) between about 10-50 km altitude. Its circulation is in many ways counter-intuitive, thanks mainly to the influence of waves.

Wave motions are ever-present in the atmosphere on a huge variety of scales – from turbulent eddies to thousand-kilometre planetary waves. They can basically be understood as motions which dump momentum (which changes the wind speed) when they break. Think of waves surging onshore at the beach. Out at sea, the wave doesn’t actually move water horizontally. It just moves water up and down. The wave moves but the water doesn’t. As the shore gets closer and the sea shallower, the wave breaks and water rushes forward. Edwin Gerber’s paper describes the behaviour of the wave-driven Brewer-Dobson circulation in the stratosphere.

The Brewer-Dobson circulation (BDC) transports air poleward from the tropics. This happens because waves from the troposphere are produced by mountains (think about putting a rock in a stream and imagine the swirls this produces), move up into the stratosphere and break. This breaking decreases the wind speed and air drifts towards the pole and then sinks. This is because of the principle of conservation of angular momentum. Basically, if you are spinning in a computer chair really fast, you will find it difficult to pull your arms in. If you slow down (imagine this is the effect of some waves) you will be able to pull your arms towards your body (your ‘pole’). The BDC is driven by the breaking of very large planetary waves (thousands of kilometres long)

The Brewer-Dobson circulation (schematic from University of Frankfurt)

Gerber uses a fairly simple atmospheric model to look at the behaviour of the BDC. The model isn’t meant to be like the real world. Instead it’s meant to simulate the fluid dynamics of the atmosphere in a way which looks something like the real world. It follows the same physical laws as the real world. This means the physics we learn about using the model can be applied to the real world.

This paper picks out two ways in which the BDC can change.

  1. Tropospheric control. Increase the wave activity and the BDC will become stronger.
  2. Stratospheric control. Increase the strength of the polar vortex (westerly winds in the winter hemisphere of the stratosphere) and the upward movement of waves will change.

The effects of the control mechanisms on the BDC can be easily seen by looking at the ‘age‘ of the air. This is the time since the air was at a given level in the atmosphere (in this paper, 100 hPa, or around 20 km). The picture below shows the age for different model setups. Red colours show older air, indicating a slower circulation.

Fig. 1 from Gerber (2012). Age of air. Left: (top) weak wave activity, (bottom) strong wave activity. Right: (top) weak winds in the stratosphere, (bottom) strong winds in the stratosphere.

Tropospheric control is the easier one to understand. If the BDC is driven by waves, increasing the wave activity will make it stronger. What does ‘increasing the wave activity’ mean? Well, the amplitude (‘size’) of the waves can be increased by changing the height of the mountains producing them. This is the what the study does. It sounds silly, because for the foreseeable future the mountains on this planet are going to stay much the same. But this is just the simple approach Gerber took in the paper. In fact, the amplitude of the planetary waves can be changed by large-scale changes in the air pressure in the lower atmosphere (such as the ‘Arctic Oscillation’, which is an expression of the latitude of the jet stream).

The stratospheric control mechanism is a little more subtle than the tropospheric one. Changing the winds in the stratospheric polar vortex changes the way waves behave. If the vortex is very weak, waves are trapped at the base of the stratosphere (under 20 km). This means the bottom part of the BDC speeds up, but the top part slows down. If the vortex is strong, waves can move all the way up into the stratosphere, so the top part speeds up.

Gerber’s experiments agree with some previous work indicating the BDC has two branches: an upper and a lower (you can see this in the first picture: the lower part is around 20 km while the upper part goes up to around 50 km). They seem to affected in different ways. The lower branch is most susceptible to changes in the waves coming from below; the upper branch is modified by changes in the way waves behave once they are in the stratosphere.

Why is this important? The BDC transports ozone to the poles, and ozone is important for protecting living things from harmful ultra-violet sunlight. Changes in the upward motion at the bottom of the stratosphere also change the level of the tropopause (thick blue line in the first picture). This is important because the level of the tropopause governs how much water vapour gets into the stratosphere. In the troposphere, extra water just rains out, but in the stratosphere extra water vapour exerts a warming influence on the Earth’s surface. If the tropopause gets lower it moves to a warmer region of the atmosphere, which allows more water vapour to get into the stratosphere. So it’s important we understand how and why the BDC does what it does.

It is unusual to find a single-author paper of such detail nowadays. It is also unusual to find such a readable paper on a highly technical subject. As I have said I find stratospheric dynamics quite tricky, but this paper really nicely illustrated the important physical principles without giving me a headache. There is a lot more in the paper than in this summary, but I hope it has at least given you a flavour of the clear, focused experimental design and the excellent presentation of its arguments.


1 Comment

Paper review: ‘Tuning the climate of a global model’

Citation: Mauritsen, T., et al. (2012), Tuning the climate of a global model, J. Adv. Model. Earth Syst., 4, M00A01, doi:10.1029/2012MS000154.

The other day I read a really excellent paper in the open-access model development journal JAMES (Journal of Advances in Modeling Earth Systems).

The unique aspect of this paper is its frankness. In it the authors speak in a clear and honest way about how they tuned the new model from the Max Planck Institute, MPI-ESM. They discuss the goals of tuning and the methods used to accomplish this. Previously model development, seen as an unglamourous subject, has not been deemed worthy of publications. Although they write from the point of view of MPI-ESM, the concepts are relevant to all models.

Evaluating models based on their ability to represent the TOA [top of the atmosphere] radiation balance usually reflects how closely the models were tuned to that particular target, rather than the models’ intrinsic qualities.

…[W]e both document and reflect on the model tuning that accompanied the preparation of a new version of our model system…Through the course of preparation we took note of the decision-making process applied in selecting and adjusting parameters, and these notes are elaborated upon…

The language here is remarkably self-aware. Previous generations of climate models were relatively poorly documented and contained plenty of mysteries, even to those who developed them. It is unlikely comphrensive notes on the decision-making process (not just the outcome) were recorded in the development of the CMIP3 models. Developers of the CMIP5 models are required to publish more details of their model formulation. This is a good thing, but his paper goes beyond that. It gives us an insight into the actual process by which the model was developed, not just the end result.

In this paper the authors go on to alter parameters to produce three alternative ‘worlds’. Whereas a perturbed-physics ensemble systematically varies all parameters within preset bounds and runs with a huge number of combinations, here the focus is on finding an equally-valid tuned set of parameters. The model developers recognise that some choices in the tuning process are somewhat subjective and that other equally-defensible choices could be made. They then look at the differences between the ‘official’ MPI-ESM and the three alternative ‘worlds’. They find some intriguing differences in the way the models represent smaller-scale features like the land/ocean contrast in tropical rainfall; usually such improvements weaken other aspects of the model’s climate, introducing an interesting trade-off.

Another interesting point is the extent to which models’ ability to reproduce the 20th Century temperature record is the result of tuning. The authors squash this idea:

The MPI-ESM was not tuned to better fit the 20th Century. In fact, we only had the capability to run the full 20th Century simulation…after…the model was frozen.

Thus the tuning was based more on physical metrics like the radiation balance at the top of the atmosphere, cloud and water vapour amounts. The emphasis was to produce a model which fits with our physical understanding rather than simply producing a simulator which reproduced observed temperatures.

For me, one of the implications of this paper was the importance of maintaining numerous independent models. As the authors here so candidly explains, model tuning is a subjective process. Choices are made to improve the representation of some aspects of the climate system which may degrade performance in other areas. Which areas are considered more important depend on the opinions of the modelling group and their research focus. By having numerous models with different strengths and weaknesses (partially a result of the choices made during the tuning process) and considering results from the models together (this is the goal of the CMIPs) we can hope to remove any bias introduced by these subjective choice.