Angus Ferraro

A tiny soapbox for a climate researcher.


Leave a comment

A physically consistent view of changes in the tropical atmosphere in response to global warming

What determines how much global warming we are going to see? In the long term it all comes down to feedbacks – changes in the climate system in response to warming which act to strengthen or weaken the eventual total warming. I have a new paper out in Journal of Climate with co-authors Hugo Lambert, Mat Collins and Georgina Miles looking at two of the main climate feedbacks in satellite observations and climate models.

One of the main feedbacks is the positive water vapour feedback, which comes about because a warmer atmosphere holds more water vapour, a greenhouse gas, which amplifies the warming. In climate models, a strong positive water vapour feedback is usually associated with a strong negative lapse rate feedback (which arises because the atmosphere warms faster than the surface). This means that models agree more on the size of the combination of these two feedbacks than they do on the size of the individual components.

We can imagine why the water vapour and lapse rate feedbacks would oppose each other. The water vapour feedback happens because atmospheric specific humidity increases with warming. The humidity of the upper troposphere is especially important for controlling the amount of radiation the Earth emits to space. If upper tropospheric humidity increases, the amount of radiation emitted to space goes down and the Earth warms up.

Now, atmospheric humidity is controlled by transfer of water from the surface, so generally any water vapour in the atmosphere must have got there by condensation. Since condensation releases heat, increasing humidity must generally be accompanied by atmospheric warming. This physical picture is especially appropriate for the Tropics, where convective storms provide the main pathway for water to get into the upper troposphere. Isaac Held has a number of posts on this topic on his blog – for example, this introduction to the concept of the moist adiabat. Outside the Tropics convection doesn’t link the upper troposphere so strongly to the surface, so the picture becomes a little more complex.

The question is: do the water vapour and lapse rate feedbacks oppose each other on a regional basis as well as a global basis?
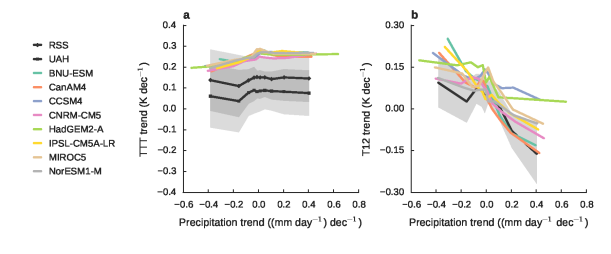
Modelled and observed changes in HIRS Channel 12 brightness temperature (a proxy for upper-tropospheric humidity) as a function of precipitation trend.

Figure 1. Regional modelled and observed changes in tropical HIRS Channel 12 brightness temperature (a proxy for upper-tropospheric humidity) as a function of precipitation trend.

Observing climate feedbacks

In climate models it is possible to calculate feedbacks quite accurately. This involves running a radiative transfer calculation on the atmospheric properties from a present-day model simulation, then swapping in the atmospheric properties of interest from a warmer climate. For example, for the water vapour feedback we should change just the water vapour content of the atmosphere and use the radiative transfer calculation to look at what it does to the outgoing radiation. This procedure can’t really be done with observations because we can’t observe the warmer climate! There are also complications in working out what the observed atmospheric properties are. Satellites can help, but they measure radiation, not the atmospheric properties directly, so we have to introduce a modelling step to derive them. These so-called ‘retrievals’ can in some cases be very accurate, but the additional calculation introduces some uncertainty into the analysis.

Nevertheless, using this technique we can observe the water vapour feedback associated with year-to-year variations in atmospheric humidity, but we then have to take care drawing links between these variations and the potential feedback associated with long-term global warming. Gordon et al (2013) found that the water vapour feedback in response to short-term variations was less than that in response to long-term global warming.

We took a different approach in our paper. Rather than look at variations in the climate system we looked at 30-year trends over some of our longest-running satellite observations. For upper-tropospheric humidity, we looked at the brightness temperature at a wavelength of about 6.7 microns, as measured by the High-resolution Infrared Sounder (HIRS). This corresponds to the amount of outgoing radiation at the centre of one of the absorption bands of water vapour. For upper-tropospheric temperature, we looked at the microwave emissions as measured by the Microwave Sounding Unit (MSU). Rather than trying to use these data sources to derive the atmospheric properties to compare with climate models, we instead calculated what these observations would look like if climate models were real. One can do this using radiative transfer calculations that have been shown to be quite accurate.

We then looked at the observed changes in these two quantities and compared them with the corresponding changes in climate model simulations. Since we were interested in specifically the behaviour of the atmosphere, we used model simulations in which sea surface temperatures were fixed to observations for the period 1979-2009. This means we can be sure any differences we see among models are to do with the simulation of the atmosphere, not the ocean.

What we found was that the atmospheric warming over the past 30 years has been fairly uniform across the Tropics (Figure 1a). This is because, in this part of the world, the Earth is rotating quite slowly and is unable to maintain strong temperature gradients. To borrow an analogy from Isaac Held, you can think of this as being like a tank of water unable to maintain a higher level in the centre than at the edges. If the tank was rotating it would be able to do so (this is more like the situation near the poles). Recalling that the lapse rate feedback is basically to do with the difference in the rate of warming of the surface and the atmosphere, this means that the regional pattern of the lapse rate feedback would be mainly determined by the regional pattern of the surface temperature changes.

On the other hand, we found that the pattern of changing atmospheric humidity was quite variable (Figure 1b). Unsurprisingly, in the Tropics this is strongly related to precipitation, since the convective storms that moisten the upper troposphere also produce rainfall.

Bringing the evidence together

These two patterns are quite well reproduced among climate models, which is nice to see. They are doing what we physically expect, but this result spawns another question.

Tropical precipitation changes under global warming can be thought of as a combination of two effects. First, a warmer atmosphere holding more water means that convective storms tend to rain more. Second, the pattern of surface warming tends to shift the regions in which convective storms happen. If the water vapour feedback’s regional pattern is related to precipitation, which of these two effects matters more? We used climate model simulations to answer this question to take advantage of the additional detail they provide.

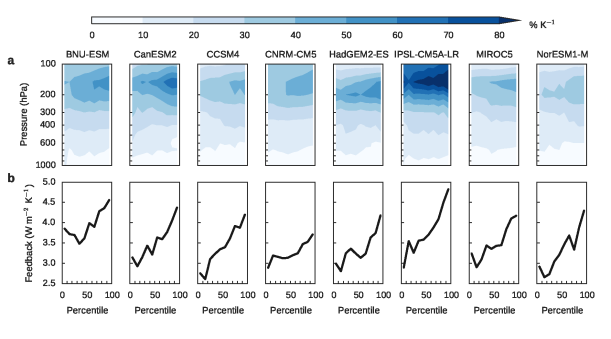
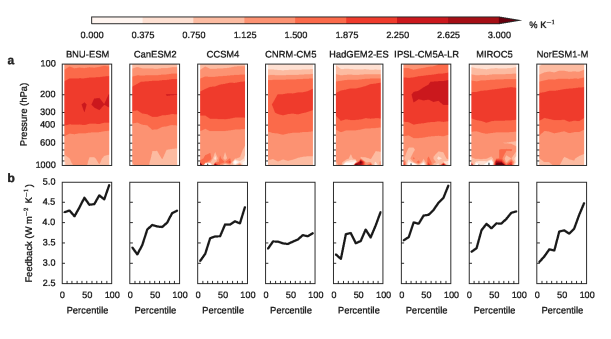
We found that, even when we accounted for the shifting convective storms, the pattern of strong atmospheric humidity increases in the regions of the greatest increases in rainfall persisted. Crucially, after accounting for the shifts, we found there was some relationship between the water vapour and lapse rate feedbacks on a regional scale, just as we saw on the global scale. A strong positive water vapour feedback is associated with a strong negative lapse rate feedback (compare Figure 2b with Figure 3b below).

Now we have a coherent picture emerging. There is no relationship between the water vapour and lapse rate feedbacks on a regional basis, in spite of the relationship on global basis, because atmospheric temperature changes get ‘mixed out’ horizontally much more than humidity changes. However, if we remove the effects of shifting precipitation patterns on the feedbacks, a relationship starts to emerge. The relationship is not strong, indicating the fundamental difference in horizontal mixing is still having an effect, but it is there. Climate models reproduce these patterns in a similar manner to the observations we looked at.
hus_percentiles

Figure 2. (a) Modelled changes in atmospheric specific humidity in response to a quadrupling of CO2 concentrations. (b) Modelled water vapour feedback. Data are presented in percentiles of precipitation with the regions of heaviest precipitation on the right.
ta_percentiles

Figure 3. (a) Modelled changes in atmospheric temperature in response to a quadrupling of CO2 concentrations. (b) Modelled lapse rate feedback. Data are presented in percentiles of precipitation with the regions of heaviest precipitation on the right.

These results are not a particularly stringent test of climate models. The relevant physics are quite simple so it would be a huge surprise if they did not behave in this manner. However, our research is still useful because it indicates the models do behave in physically sensible ways and that we can use them to explain the regional distribution of the water vapour and lapse rate feedbacks.

We also asked whether a model’s representation of these feedback patterns tells us anything about the total strength of these feedbacks – in other words, how much global warming we might see for a given increase in carbon dioxide concentrations. Unfortunately, we didn’t see a relationship here. This might be because we only used eight climate models in our investigation, but it might also be that there is no physical link between the two things.


Ferraro AJ, FH Lambert, M Collins and GM Miles (2015), Physical Mechanisms of Tropical Climate Feedbacks Investigated using Temperature and Moisture Trends, J. Clim, doi:10.1175/JCLI-D-15-0253.1.


Leave a comment

A hiatus in the stratosphere?

During the past few decades the rate at which the Earth’s surface has been warming has decreased. This has been called a ‘pause’ or ‘hiatus’ in global warming. At the same time, the cooling of the lower stratosphere has similarly paused. What’s going on here? Now is a good time to review what we know about drivers of temperatures in different parts of the atmosphere.


Carbon dioxide has a warming effect on the surface and the troposphere (the lowest 10 km or so of the atmosphere) because it absorbs infrared radiation, reducing the amount of energy the troposphere can emit to space. But higher up in the stratosphere (between about 10 and 50 km) carbon dioxide actually has a cooling effect. The reason for this is a bit subtle, but it can essentially be thought of as a result of thin air at high altitudes, which means a lot of the emission from the stratosphere at the wavelengths at which carbon dioxide absorbs is straight out to space; in the troposphere on the other hand there is more reabsorption.

a, Annual global-mean surface and stratospheric temperatures. Surface temperatures from the NASA GISTEMP data set. Stratospheric temperatures are derived from measurements from different channels of the Microwave sounding unit, processed by remote sensing systems. Lower stratosphere (TLS; approximately 14–22 km) and middle stratosphere (C13; approximately 30–40 km). b, Decadal-mean temperatures simulated by seven chemistry–climate models (CCSRNIES, CMAM, LMDZrepro, MRI, SOCOL, UMSLIMCAT and WACCM) for the 14–22 km altitude range relative to 1990–1999 for the CCMVal-2 scenario REF-B2 (All), which uses the IPCC A1B greenhouse-gas scenario. The well-mixed greenhouse gases scenario is the same as REF-B2 but has fixed ODS, and the ODS scenario has fixed greenhouse-gas concentrations. Markers denote the multi-model mean and bars indicate the inter-model range.

The strange case of the two hiatuses

Since 1979 we’ve been able to measure the temperature of the stratosphere using satellite instruments. The lower stratosphere cooled until the mid-1990s, but since then its temperature has barely changed. This flattening of lower stratospheric cooling is happening at the same time as the flattening of surface warming. That’s a little odd – surface warming has paused, and stratospheric cooling has paused as well! Are these things somehow linked? Just looking naively at the temperature data one might be forgiven for thinking something is wrong with our theories of what carbon dioxide does to the atmosphere.

I have a correspondence piece out today in Nature Climate Change with coauthors Mat Collins and Hugo Lambert explaining this little mystery and reviewing some of the great scientific work on understanding drivers of stratospheric temperature change. The ‘pause’ in global surface warming has attracted a lot of attention in recent years, and appears to be mostly a result of natural variations in the amount of heat being taken into the ocean, but at the same time there has been plenty of important scientific research on stratospheric temperature trends that has received rather less attention.

In short, the answer is that the two ‘hiatuses’ are not related to each other, and neither are inconsistent with the scientific basis of global warming by increasing carbon dioxide concentrations.

What drives stratospheric temperature change?

It turns out the main cause of lower stratospheric cooling since 1979 is not carbon dioxide. This is mainly because the lower stratosphere is not very sensitive to a change in carbon dioxide concentrations. It has a much greater effect higher up (the ‘middle stratosphere’ line in the figure above shows strong cooling over the period for which measurements are available). The cooling effect is still there, but it’s not the main culprit for past changes.

The missing piece is what’s been happening to stratospheric ozone. Ozone absorbs solar radiation and warms the air, which means ozone-rich parts of the stratosphere are actually warmer than the upper parts of the troposphere.

Emissions of chlorofluorocarbons (CFCs) and other similar substances have caused the amount of ozone in the stratosphere to decline over past decades. The declining ozone meant less solar radiation was absorbed, so the stratosphere cooled down. It has also led to an increase in harmful ultraviolet radiation from the Sun reaching the surface. Concern about the damage to the ozone layer led to international regulations on the emissions of CFCs and other ozone-depleting substances, starting with the Montreal Protocol in 1989. Now the ozone layer is beginning to show signs of recovery.

So it is ozone, not carbon dioxide, that has been the main driver of lower stratospheric cooling since 1979. The flattening out of the stratospheric cooling trend is because ozone levels have stopped declining.

A delicate balance for the future

Does that mean that, as the ozone layer recovers, we should expect the lower stratosphere to warm up again in the future? In fact it’s a little more complicated than that. Although carbon dioxide isn’t the main cause of past stratospheric cooling, if we keep emitting it at an accelerating rate its effects will start to become more important. In the future we might see carbon dioxide becoming a major influence on the temperature of the lower stratosphere.

Although we know that carbon dioxide causes stratospheric cooling and ozone causes stratospheric warming, the size of their effects is very complicated to calculate. It depends not just on the effects of these substances on radiation but on complex interactions with the atmospheric circulation, and in the case of ozone is also heavily dependent on complex chemical reactions.

This means climate model projections simulate a broad range of possible future temperature trends. The figure shows differences in lower-stratospheric temperature relative to the 1990s in simulations with 8 climate models including the detailed descriptions of changing stratospheric chemistry that are required to accurately simulate changes in ozone. The black bars show the combined effects of both greenhouse gases (mainly carbon dioxide) and ozone-depleting substances (mainly CFCs). The coloured bars show their individual contributions. The simulations show ozone-depleting substances were the main drivers of past stratospheric cooling. In the future the models simulate a large range of influences.

What all this means is that the future of lower stratospheric temperature will be determined by a tug-of-war between the warming influence of recovering ozone and the cooling influence of increasing carbon dioxide. It is actually difficult to work out which of these effects will win out. It’s even possible they could cancel each other out and the period of constant lower-stratospheric temperatures could continue for decades. In contrast, the period of flat surface temperatures is likely to end in the next few years, and we are very confident it will end with a period of warming (likely accelerated warming as heat is transferred from the oceans to the atmosphere).


Ferraro AJ, M Collins and FH Lambert (2015), A hiatus in the stratosphere?, Nature Clim. Change 5 497-498, doi:10.1038/nclimate2624.


2 Comments

EUMETSAT Conference 2014: Final highlights

2014-09-27 11.27.13

Headquarters of the WMO, which we visited during the conference for a discussion on the socioeconomic benefits of meteorological satellites.

The EUMETSAT Meteorological Satellites Conference 2014 featured a lot of new science. Two particular points which stood out to me was the assimilation of new products into numerical weather forecasting systems, and the use of satellite data in improving our conceptual understanding of weather systems.

Until this conference I was not aware how new it was to incorporate soil moisture into numerical weather forecasting systems. Such forecasting systems spend a good deal of resources on assimilating observational data to initialise the forecast. This is very important because, as pioneering work by Ed Lorenz showed back in the 1960s, tiny differences in the initial state of an atmospheric model (and of course the real atmosphere) can lead to huge differences in the resulting forecast, even for relatively short-range forecasts.

Soil moisture is clearly a useful thing to know about in our forecasts. For weather forecasts it mainly plays a role in supplying water for weather systems. Wet surfaces supply water to the atmosphere, causing or intensifying rainfall.

A few years ago soil moisture satellite products were not considered mature enough to assimilate into weather forecast systems. This is partly because our measurements were quite uncertain (we couldn’t attach very accurate numbers to them), but also because our uncertainty was poorly characterised (we didn’t know how accurate our measurements were). In a sense, the latter is more important. Like much of science, the point is not always knowing things exactly, but accepting that it’s impossible to achieve perfect accuracy and to at least know exactly how certain we are about a measurement (Tamsin Edwards has a related blog post focusing on climate rather than weather).

After some experimental studies showed the potential for soil moisture data to improve weather forecasts, operational forecasting centres across the world began to adopt this extra data source – the ones I heard about at the conference were ECMWF and the UK Met Office, but there are probably others.

Now let’s move to something less mathematical, but equally as important and exciting. On Thursday I listened to two excellent presentations on the Conceptual Models for the Southern Hemisphere (CM4SH) project. The rationale behind CM4SH is that the vast majority of weather forecasting ‘wisdom’ is derived from Northern Hemisphere perspectives, through an accident of history. But understanding the weather of the Southern Hemisphere isn’t as simple as flipping everything upside down. Although the physics of the weather is clearly the same, the actual meteorological situation in Southern Hemisphere countries is different. For example, South Africa lies in the midlatitude belt like Europe does, but it sits rather closer towards the Equator, so the same weather system could have different effects. The configuration of Southern Hemisphere land masses is very different, and that leads to rather different weather behaviour.

CM4SH is a collaboration between the national meteorological services of South Africa, Argentina, Australia and Brazil. The work focused on building up a catalogue of typical meteorological situations in different regions of the Southern Hemisphere, analysing similarities and differences. The international CM4SH team used Google Drive to build a catalogue of these situations, their typical causes, behaviour and effects. Satellite imagery is obviously a major part of the catalogue, as it allows forecasters to track the flow of moisture, presence of clouds, direction and strength of winds. The resulting catalogue allows Southern Hemisphere forecasters to classify meteorological situations and quickly find out the typical effects of different systems. For example, if a forecaster sees a particular meteorological configuration, they can quickly check the catalogue for the effects of similar situations in the past, and see that they need to assess the risk of, say, flooding, in a vulnerable region.

I think projects like this reflect the power of the Internet to supercharge our science. Earlier this week I wrote about how the data from the new GPM mission were available and easily accessible within weeks. GPM is a huge international collaboration combining the resources of a whole constellation of satellites. CM4SH is a project which makes use of expertise from four national meteorological services to create an unprecedented collaborative resource for forecaster training and education, freely available. The CM4SH catalogue will grow over time and become more refined – the beauty of collaborative projects like this is that, as long as someone does a little pruning now and then, they can only ever become more useful.

EUMETSAT Post 1: Challenges and advances in satellite measurement

EUMETSAT Post 2: Socioeconomic benefits of meteorological satellites


2 Comments

EUMETSAT Conference 2014: Socioeconomic benefits of meteorological satellites

Globally, governments spend about $10 billion on meteorological satellites every year. That’s a lot of money. How do we know it’s worth it?

Yesterday night the EUMETSAT conference branched off to the WMO for a side-event asking that very question. I was impressed by the rigour of their calculations, but also by the thoughtful responses to the question of how this information should – and should not – be used.

Alain Ratier, Director of EUMETSAT, presented the results of a comprehensive activity aiming at calculating the benefit-cost ratio to the EU of polar-orbiting meteorological satellites. The cost of these things is relatively easy to estimate, but the benefits are a little more difficult. They approached the problem in two steps: first, what is the economic benefit derived from weather forecasts? Second, what impact do meteorological satellites have on weather forecast skill?

The resulting report contains some fascinating facts and figures. It has been estimated that as much as one third of the EU’s GDP is ‘weather-sensitive’. Of course, this isn’t the same as ‘weather forecast sensitive’, but it at least gives a sense of potential vulnerability. The report concluded that the total benefit of weather forecasts to the EU was just over €60 billion per year. Most of that comes in the form of ‘added value to the European economy’ (broadly, use of weather information to help manage transport networks, electricity generation, agricultural activities, and so on), but there are also contributions from protection of property and the value of private use by citizens.

Compared to the calculation of the economic benefits of weather forecasts, the calculation of the effects of satellite data on those forecasts is quite straightforward. One can assess this by ‘suppressing’ source of data in our weather forecasts. Forecasts proceed by using a numerical model of atmospheric physics to predict the future atmospheric state. Since weather prediction is a chaotic problem, it’s important we start the forecast from as close as possible a representation of the real atmospheric state. This is called initialisation and it’s absolutely crucial to weather forecasting.  In order to calculate the effects of satellite information, we can simply exclude satellites from the initialisation phase of the weather prediction.

(left) 5-day forecast for Superstorm Sandy, (middle) the forecast without polar-orbiting satellite data and (right) the actual conditions that occurred. Credit: ECMWF.

The results are quite astounding. Satellite data contributes 64% of the effect of initialisation in improving 24-hour forecasts (the other 36% comes from in-situ observations). This approach reveals that measurements from a single satellite, the EUMETSAT MetOp-A, accounts for nearly 25% of all the improvement in 24-hour forecast accuracy derived from observations. MetOp-A is a relatively new platform, indicating that recent advances are providing huge benefits to weather forecasts.

The impact of satellite observations is vividly illustrated by considering 5-day forecasts of the track of Superstorm Sandy made with and without satellite initialisation. Without the use of polar-orbiting satellites, forecasters would not have predicted that the storm would make landfall on the Western US coast. As it was, the 5-day forecast of the storm track was remarkably close to reality, allowing forecasters to issue warnings of imminent risk of high winds and flooding.

The conclusion is that meteorological satellites provide benefits that outweigh their costs by a factor of 20. This is a conservative estimate in which high-end cost estimates have been compared with low-end benefit estimates. One reason we might expect benefit estimates to be low is that private companies are often reluctant to reveal how they use weather forecasts, either because this information is commercially sensitive or because they risk being charged more for the forecast data they receive!

It’s important to consider the limits of this approach. The obvious one is that cost-benefit estimates do not include the number of human lives that have been saved by weather forecasts. Not only is this difficult to calculate, it’s also impossible to put an economic value to. It would be very interesting to see if the toolbox of social science research has some methods to assess the ‘social’ part of the ‘socioeconomic’ benefits, moving away from attaching monetary value to things and considering those benefits which aren’t as easy to quantify. This doesn’t have to mean human life; any non-monetary social benefit of weather forecasting could be considered.

I think this is especially valuable because it’s questionable whether the cost-benefit approach is truly appropriate. Cost-benefit analyses frame things in a certain way; the WMO and EUMETSAT representatives at the meeting were well aware of this. They may imply greater certainty than is appropriate, and they may encourage a naively quantitative approach to what is fundamentally a qualitative problem: is it for better or for worse that we have meteorological satellites? Answering such a question involves some value judgements simple quantitative approach can gloss over. As LP Riishøjgaard pointed out, although we can make this kind of cost-benefit estimate ‘frighteningly’ easily, it’s not obvious that we should.

EUMETSAT Post 1: Challenges and advances in satellite measurement.

EUMETSAT Post 3: Final highlights.


2 Comments

EUMETSAT Conference 2014: Challenges and advances in satellite measurement

Atmospheric measurement is an extraordinarily difficult problem. It’s a fluid capable of remarkable feats of contortion, and it contains a number of important constituents, including one – water – which flits easily between solid, liquid and gaseous forms. Satellite instruments offer a unique way to measure the state of the atmosphere, viewing broad swaths of the planet from space.

I’m at the EUMETSAT Meteorological Satellites Conference in Geneva, which is as good a place as any to understand what a remarkable achievement this is. These are my highlights from the first two days, and reflect my particular interests, so I have probably missed a host of other interesting scientific advances.

A major theme of the ‘climate’ session at the conference was the problem of generating long-term climate records from satellite data that is often very choppy. Satellites and their instruments can have very short lifetimes, usually just a few years, though some (like the rather venerable 17-year-old TRMM) buck the trend. Satellites can only carry so much fuel to keep them in orbit, and their instrumentation gradually degrades over time in the harsh environment of space. To maintain a long-term record, you would want to send up identical instruments into identical orbits – but in reality this is not possible. The instruments themselves are made with extraordinary levels of precision, but their complex and delicate nature means it’s not actually possible to make them identical. They will usually have slightly different sensitivies. The satellites carrying them will have different orbits, which means they might measure different parts of the Earth at different times.

Changes like this can cause major stability problems for satellite records. Each time a new instrument goes up on a new satellite the record tends to ‘jump’. Common reasons for this include slight differences in the sensor’s sensitivity, and sampling changes due to the different orbit. As an example, rainfall in the Tropics usually peaks in the afternoon. If you send up a new instrument which passes over the Equator in the morning, it will look like rainfall has abruptly decreased compared to one that passes in the afternoon, but all that’s happened is that you’re measuring it at a different time. These so-called ‘inhomogeneities’ need correction if we are to stand a chance of using these records for studies of climate (which is the statistics of the atmosphere and oceans over decades – many satellite lifetimes).

The ‘climate’ session at EUMETSAT highlighted many approaches to such problems. There was also discussion of the potential for improving the physical consistency between datasets, so common ‘budgets’ can be closed. However, the fact that our observations sometimes don’t ‘add up’ is an important piece of information. It means we’re getting something wrong – but exactly what is of course a rather difficult question.

On Tuesday afternoon a session on precipitation measurement included some very impressive results from the new Global Precipitation Measurement (GPM) mission. A number of technological advances, combined with a unique approach of using two reference satellites to calibrate the measurements from a ‘constellation’ of 11 others, now provide unprecedented detail on Earth’s rain and snowfall. High-frequency microwave measurements combined with radar allow us to look at the icy parts of clouds and to see areas where even very light rain is falling. This allows us to look at, for example, tropical storms in a whole new light – and most importantly, because it’s based on such a huge array of measurement platforms, we won’t miss a single one.

Another impressive aspect of the GPM mission is the speed with which things have moved. Since its launch in February 2014 GPM has been providing huge streams of data, which an international team has worked on to convert to precipitation measurements. Within a short time the data were available to the public. The data were available to the world’s major weather forecasting centres within 2 weeks, allowing them to get a much better picture of the current state of the atmosphere (this is important because small errors in the initial state of the atmosphere can lead to large errors in a weather forecast). In short, GPM looks like a thoroughly modern measurement misson: an international collaboration, operating openly and with detailed documentation, providing timely and freely-available data. Plus it produces some cool graphics (see below).

One of the first storms observed by the NASA/JAXA GPM Core Observatory on March 17, 2014, in the eastern United States revealed a full range of precipitation, from rain to snow. Image Credit: NASA/JAXA

The day closed with a visit to the headquarters of the World Meteorological Organisation for presentations and discussions on the socioeconomic value of satellite data – that’s covered in another post.

EUMETSAT Post 2: Socioeconomic benefits of meteorological satellites. 

EUMETSAT Post 3: Final highlights.