Angus Ferraro

A tiny soapbox for a climate researcher.


2 Comments

Can stratospheric aerosols directly affect global precipitation?

What is the effect of stratospheric aerosol geoengineering on global precipitation? If we were to inject sulphate aerosol into the stratosphere it would reflect some sunlight and cool the Earth, but the atmosphere’s CO2 levels would remain high. This is important, because CO2 actually has an effect on precipitation even when it doesn’t affect surface temperature. In a recent paper with a summer student, I’ve shown the aerosols can contribute a similar effect.
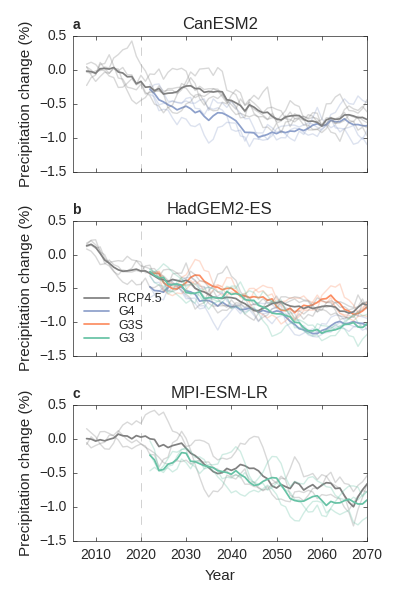
Three climate models (CanESM2, HadGEM2-ES, MPI-ESM-LR) did simulations of the future with and without geoengineering. The simulations with stratospheric aerosols (G3 and G4) show greater temperature-independent precipitation reductions than the simulations without them (RCP4.5 and G3S).

Three climate models (CanESM2, HadGEM2-ES, MPI-ESM-LR) did simulations of the future with and without geoengineering. The simulations with stratospheric aerosols (G3 and G4) show greater temperature-independent precipitation reductions than the simulations without them (RCP4.5 and G3S).

Precipitation as energy flow

Precipitation transfers energy from the Earth’s surface to its atmosphere. It takes energy to evaporate water from the surface. Just as evaporation of sweat from your skin cools you off by taking up heat from your skin, evaporation from the Earth’s surface cools it through energy transfer. Precipitation occurs when this water condenses out in the atmosphere. Condensation releases the heat energy stored when the water evaporated, warming the atmosphere. Globally, precipitation transfers about 78 Watts per square metre of energy from the surface to the atmosphere. Multiplying that by global surface area that’s a total energy transfer of about 40 petajoules (that’s 40 with 15 zeros after it) of energy every second! To put that in a bit of context, it’s about 40% of the amount of energy the Sun transfers to the Earth’s surface.

If precipitation changes, that’s the same as saying the atmospheric energy balance changes. If we warm the atmosphere up, it is able to radiate more energy (following the Stefan-Boltzmann law). To balance that, more energy needs to go into the atmosphere. This happens through precipitation changes.

Direct effects of gases on precipitation

Now imagine we change the amount of CO2 in the atmosphere. This decreases the amount of energy the atmosphere emits to space, meaning the atmosphere has more energy coming in than out. To restore balance the atmospheric heating from precipitation goes down. This means that the global precipitation response to global warming from increasing CO2 has two opposing components: a temperature-independent effect of the CO2, which decreases precipitation, and a temperature-dependent effect which arises from the warming the CO2 subsequently causes. In the long run the temperature-dependent effect is larger. Global warming will increase global precipitation – although there could be local increases or decreases.

But what happens if we do geoengineering? Say we get rid of the temperature-dependent part using aerosols to reduce incoming solar radiation. The temperature-independent effect of CO2 remains and global precipitation will go down.

Detecting the effect of stratospheric aerosol

CO2 isn’t the only thing that has a temperature-independent effect. Any substance that modifies the energy balance of the atmosphere has one. In our new study, we ask whether stratospheric sulphate aerosol has a detectable effect on global precipitation. Theoretically it makes sense, but it is difficult to detect because usually there are temperature-dependent effects obscuring it.

We used a common method to remove the temperature-dependent effect. We calculated the precipitation change for a given surface temperature change from a separate simulation, then used this to remove the temperature-dependent effect in climate model simulations of the future. We did this for future scenarios with and without geoengineering.

As expected, we found a temperature-independent influence which reduced precipitation. Importantly, this effect was bigger when geoengineering aerosols were present in the stratosphere. This was detectable in three different climate models. The figure above shows this. The non-geoengineered ‘RCP4.5’ simulation shows a precipitation decline when the temperature effect is removed. This comes mainly from the CO2.  The ‘G3’ and ‘G4’ geoengineering simulations (blue and green lines) have an even greater decline. The aerosol is acting to decrease precipitation further.

How does aerosol affect precipitation?

The temperature-independent effect wasn’t present when geoengineering was done by ‘dimming the Sun’. The ‘G3S’ simulation  (orange lines in the figure) does this, and it has a similar precipitation change to RCP4.5. So what causes the precipitation reduction when stratospheric aerosols are used? We calculated the effect of the aerosol on the energy budget of the troposphere (where the precipitation occurs). We separated this in two: the aerosol itself, and the stratospheric warming that occurs because of the effect of the aerosol on the stratosphere’s energy budget.
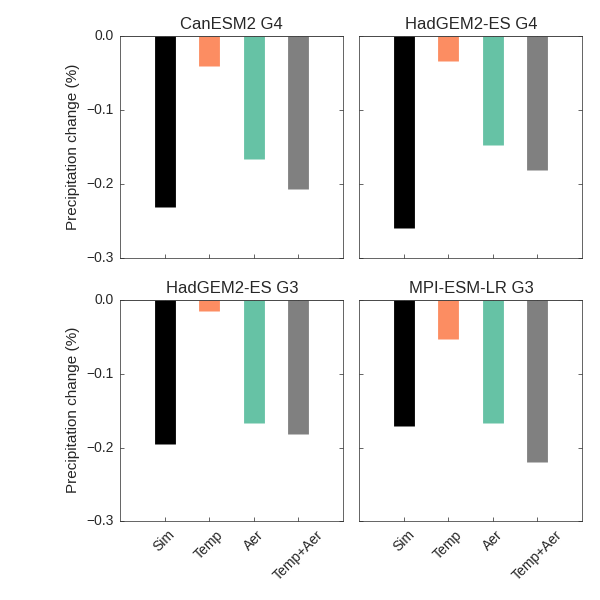
Black bars show the temperature-independent precipitation changes simulated by the models. Orange bars show our calculation of the effect of the stratospheric warming. Green bars show our calculation of effect of the aerosol itself. Grey bars show our calculation of the total effect, which is very close to the actual simulated result.

Black bars show the temperature-independent precipitation changes simulated by the models. Orange bars show our calculation of the effect of the stratospheric warming. Green bars show our calculation of effect of the aerosol itself. Grey bars show our calculation of the total effect, which is very close to the actual simulated result.

We found the main effect was from the aerosol itself. The aerosol’s main effect is to reduce incoming solar radiation and cool the surface. But we showed it also interferes a little with the radiation escaping to space, and this alters the energy balance of the troposphere. The precipitation has to respond to these energy balance changes.

This effect is not huge. We had to use many model simulations of the 21st Century to detect it above the ‘noise’ of internal variability. In the real world we only have one ‘simulation’, so this implies the temperature-independent effect of stratospheric aerosol on precipitation would not be detectable in real-world moderate geoengineering scenario. This also means climate model simulations not including the effects of the aerosol could capture much of the effects of geoengineering on the global hydrological cycle.

This effect could be more important under certain circumstances. If geoengineering was more extreme, with more aerosol injected for longer, precipitation would decrease more. But, based on these results, the main effect of geoengineering on precipitation is that the temperature-dependent changes are minimised. This means the temperature-independent effect of increasing CO2 concentrations is unmasked, reducing precipitation.

Take a look at the paper for more details – it’s open access!

Ferraro, A. J., & Griffiths, H. G. (2016). Quantifying the temperature-independent effect of stratospheric aerosol geoengineering on global-mean precipitation in a multi- model ensemble. Environmental Research Letters, 11, 034012. doi:10.1088/1748-9326/11/3/034012.


On a personal note, this paper is significant because it is the culmination of the first research project I truly led.  Of course I managed my own research as a PhD student and post-doc, but my supervisors secured the funding. They also acted as collaborators. Here I came up with the idea, applied for funding, supervised Hannah (the excellent student who did much of the analysis) and wrote up the results. It’s a milestone on the way to becoming an independent scientific researcher. For this reason this work will always be special to me. Thanks also to Hannah for being such a good student!

Leave a comment

A physically consistent view of changes in the tropical atmosphere in response to global warming

What determines how much global warming we are going to see? In the long term it all comes down to feedbacks – changes in the climate system in response to warming which act to strengthen or weaken the eventual total warming. I have a new paper out in Journal of Climate with co-authors Hugo Lambert, Mat Collins and Georgina Miles looking at two of the main climate feedbacks in satellite observations and climate models.

One of the main feedbacks is the positive water vapour feedback, which comes about because a warmer atmosphere holds more water vapour, a greenhouse gas, which amplifies the warming. In climate models, a strong positive water vapour feedback is usually associated with a strong negative lapse rate feedback (which arises because the atmosphere warms faster than the surface). This means that models agree more on the size of the combination of these two feedbacks than they do on the size of the individual components.

We can imagine why the water vapour and lapse rate feedbacks would oppose each other. The water vapour feedback happens because atmospheric specific humidity increases with warming. The humidity of the upper troposphere is especially important for controlling the amount of radiation the Earth emits to space. If upper tropospheric humidity increases, the amount of radiation emitted to space goes down and the Earth warms up.

Now, atmospheric humidity is controlled by transfer of water from the surface, so generally any water vapour in the atmosphere must have got there by condensation. Since condensation releases heat, increasing humidity must generally be accompanied by atmospheric warming. This physical picture is especially appropriate for the Tropics, where convective storms provide the main pathway for water to get into the upper troposphere. Isaac Held has a number of posts on this topic on his blog – for example, this introduction to the concept of the moist adiabat. Outside the Tropics convection doesn’t link the upper troposphere so strongly to the surface, so the picture becomes a little more complex.

The question is: do the water vapour and lapse rate feedbacks oppose each other on a regional basis as well as a global basis?

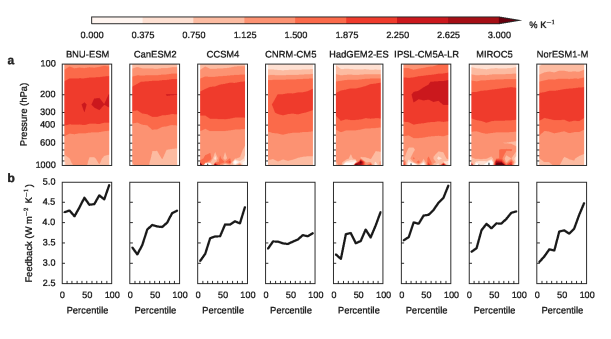
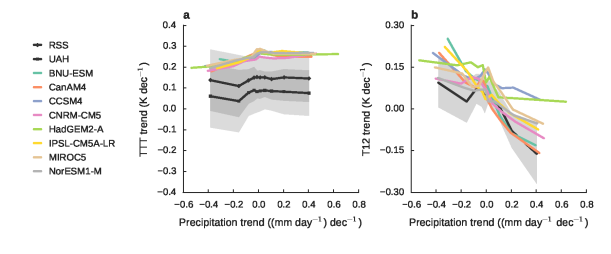
Modelled and observed changes in HIRS Channel 12 brightness temperature (a proxy for upper-tropospheric humidity) as a function of precipitation trend.

Figure 1. Regional modelled and observed changes in tropical HIRS Channel 12 brightness temperature (a proxy for upper-tropospheric humidity) as a function of precipitation trend.

Observing climate feedbacks

In climate models it is possible to calculate feedbacks quite accurately. This involves running a radiative transfer calculation on the atmospheric properties from a present-day model simulation, then swapping in the atmospheric properties of interest from a warmer climate. For example, for the water vapour feedback we should change just the water vapour content of the atmosphere and use the radiative transfer calculation to look at what it does to the outgoing radiation. This procedure can’t really be done with observations because we can’t observe the warmer climate! There are also complications in working out what the observed atmospheric properties are. Satellites can help, but they measure radiation, not the atmospheric properties directly, so we have to introduce a modelling step to derive them. These so-called ‘retrievals’ can in some cases be very accurate, but the additional calculation introduces some uncertainty into the analysis.

Nevertheless, using this technique we can observe the water vapour feedback associated with year-to-year variations in atmospheric humidity, but we then have to take care drawing links between these variations and the potential feedback associated with long-term global warming. Gordon et al (2013) found that the water vapour feedback in response to short-term variations was less than that in response to long-term global warming.

We took a different approach in our paper. Rather than look at variations in the climate system we looked at 30-year trends over some of our longest-running satellite observations. For upper-tropospheric humidity, we looked at the brightness temperature at a wavelength of about 6.7 microns, as measured by the High-resolution Infrared Sounder (HIRS). This corresponds to the amount of outgoing radiation at the centre of one of the absorption bands of water vapour. For upper-tropospheric temperature, we looked at the microwave emissions as measured by the Microwave Sounding Unit (MSU). Rather than trying to use these data sources to derive the atmospheric properties to compare with climate models, we instead calculated what these observations would look like if climate models were real. One can do this using radiative transfer calculations that have been shown to be quite accurate.

We then looked at the observed changes in these two quantities and compared them with the corresponding changes in climate model simulations. Since we were interested in specifically the behaviour of the atmosphere, we used model simulations in which sea surface temperatures were fixed to observations for the period 1979-2009. This means we can be sure any differences we see among models are to do with the simulation of the atmosphere, not the ocean.

What we found was that the atmospheric warming over the past 30 years has been fairly uniform across the Tropics (Figure 1a). This is because, in this part of the world, the Earth is rotating quite slowly and is unable to maintain strong temperature gradients. To borrow an analogy from Isaac Held, you can think of this as being like a tank of water unable to maintain a higher level in the centre than at the edges. If the tank was rotating it would be able to do so (this is more like the situation near the poles). Recalling that the lapse rate feedback is basically to do with the difference in the rate of warming of the surface and the atmosphere, this means that the regional pattern of the lapse rate feedback would be mainly determined by the regional pattern of the surface temperature changes.

On the other hand, we found that the pattern of changing atmospheric humidity was quite variable (Figure 1b). Unsurprisingly, in the Tropics this is strongly related to precipitation, since the convective storms that moisten the upper troposphere also produce rainfall.

Bringing the evidence together

These two patterns are quite well reproduced among climate models, which is nice to see. They are doing what we physically expect, but this result spawns another question.

Tropical precipitation changes under global warming can be thought of as a combination of two effects. First, a warmer atmosphere holding more water means that convective storms tend to rain more. Second, the pattern of surface warming tends to shift the regions in which convective storms happen. If the water vapour feedback’s regional pattern is related to precipitation, which of these two effects matters more? We used climate model simulations to answer this question to take advantage of the additional detail they provide.

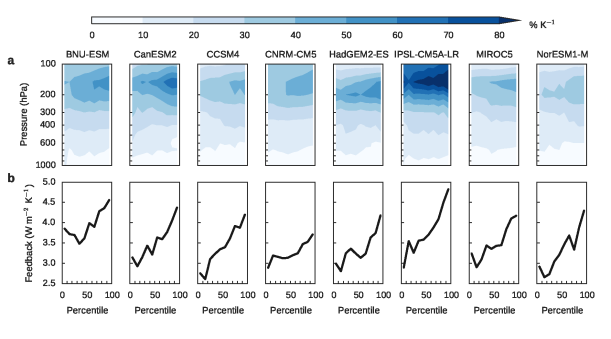
We found that, even when we accounted for the shifting convective storms, the pattern of strong atmospheric humidity increases in the regions of the greatest increases in rainfall persisted. Crucially, after accounting for the shifts, we found there was some relationship between the water vapour and lapse rate feedbacks on a regional scale, just as we saw on the global scale. A strong positive water vapour feedback is associated with a strong negative lapse rate feedback (compare Figure 2b with Figure 3b below).

Now we have a coherent picture emerging. There is no relationship between the water vapour and lapse rate feedbacks on a regional basis, in spite of the relationship on global basis, because atmospheric temperature changes get ‘mixed out’ horizontally much more than humidity changes. However, if we remove the effects of shifting precipitation patterns on the feedbacks, a relationship starts to emerge. The relationship is not strong, indicating the fundamental difference in horizontal mixing is still having an effect, but it is there. Climate models reproduce these patterns in a similar manner to the observations we looked at.

hus_percentiles

Figure 2. (a) Modelled changes in atmospheric specific humidity in response to a quadrupling of CO2 concentrations. (b) Modelled water vapour feedback. Data are presented in percentiles of precipitation with the regions of heaviest precipitation on the right.

ta_percentiles

Figure 3. (a) Modelled changes in atmospheric temperature in response to a quadrupling of CO2 concentrations. (b) Modelled lapse rate feedback. Data are presented in percentiles of precipitation with the regions of heaviest precipitation on the right.

These results are not a particularly stringent test of climate models. The relevant physics are quite simple so it would be a huge surprise if they did not behave in this manner. However, our research is still useful because it indicates the models do behave in physically sensible ways and that we can use them to explain the regional distribution of the water vapour and lapse rate feedbacks.

We also asked whether a model’s representation of these feedback patterns tells us anything about the total strength of these feedbacks – in other words, how much global warming we might see for a given increase in carbon dioxide concentrations. Unfortunately, we didn’t see a relationship here. This might be because we only used eight climate models in our investigation, but it might also be that there is no physical link between the two things.


Ferraro AJ, FH Lambert, M Collins and GM Miles (2015), Physical Mechanisms of Tropical Climate Feedbacks Investigated using Temperature and Moisture Trends, J. Clim, doi:10.1175/JCLI-D-15-0253.1.


Leave a comment

A hiatus in the stratosphere?

During the past few decades the rate at which the Earth’s surface has been warming has decreased. This has been called a ‘pause’ or ‘hiatus’ in global warming. At the same time, the cooling of the lower stratosphere has similarly paused. What’s going on here? Now is a good time to review what we know about drivers of temperatures in different parts of the atmosphere.


Carbon dioxide has a warming effect on the surface and the troposphere (the lowest 10 km or so of the atmosphere) because it absorbs infrared radiation, reducing the amount of energy the troposphere can emit to space. But higher up in the stratosphere (between about 10 and 50 km) carbon dioxide actually has a cooling effect. The reason for this is a bit subtle, but it can essentially be thought of as a result of thin air at high altitudes, which means a lot of the emission from the stratosphere at the wavelengths at which carbon dioxide absorbs is straight out to space; in the troposphere on the other hand there is more reabsorption.

a, Annual global-mean surface and stratospheric temperatures. Surface temperatures from the NASA GISTEMP data set. Stratospheric temperatures are derived from measurements from different channels of the Microwave sounding unit, processed by remote sensing systems. Lower stratosphere (TLS; approximately 14–22 km) and middle stratosphere (C13; approximately 30–40 km). b, Decadal-mean temperatures simulated by seven chemistry–climate models (CCSRNIES, CMAM, LMDZrepro, MRI, SOCOL, UMSLIMCAT and WACCM) for the 14–22 km altitude range relative to 1990–1999 for the CCMVal-2 scenario REF-B2 (All), which uses the IPCC A1B greenhouse-gas scenario. The well-mixed greenhouse gases scenario is the same as REF-B2 but has fixed ODS, and the ODS scenario has fixed greenhouse-gas concentrations. Markers denote the multi-model mean and bars indicate the inter-model range.

The strange case of the two hiatuses

Since 1979 we’ve been able to measure the temperature of the stratosphere using satellite instruments. The lower stratosphere cooled until the mid-1990s, but since then its temperature has barely changed. This flattening of lower stratospheric cooling is happening at the same time as the flattening of surface warming. That’s a little odd – surface warming has paused, and stratospheric cooling has paused as well! Are these things somehow linked? Just looking naively at the temperature data one might be forgiven for thinking something is wrong with our theories of what carbon dioxide does to the atmosphere.

I have a correspondence piece out today in Nature Climate Change with coauthors Mat Collins and Hugo Lambert explaining this little mystery and reviewing some of the great scientific work on understanding drivers of stratospheric temperature change. The ‘pause’ in global surface warming has attracted a lot of attention in recent years, and appears to be mostly a result of natural variations in the amount of heat being taken into the ocean, but at the same time there has been plenty of important scientific research on stratospheric temperature trends that has received rather less attention.

In short, the answer is that the two ‘hiatuses’ are not related to each other, and neither are inconsistent with the scientific basis of global warming by increasing carbon dioxide concentrations.

What drives stratospheric temperature change?

It turns out the main cause of lower stratospheric cooling since 1979 is not carbon dioxide. This is mainly because the lower stratosphere is not very sensitive to a change in carbon dioxide concentrations. It has a much greater effect higher up (the ‘middle stratosphere’ line in the figure above shows strong cooling over the period for which measurements are available). The cooling effect is still there, but it’s not the main culprit for past changes.

The missing piece is what’s been happening to stratospheric ozone. Ozone absorbs solar radiation and warms the air, which means ozone-rich parts of the stratosphere are actually warmer than the upper parts of the troposphere.

Emissions of chlorofluorocarbons (CFCs) and other similar substances have caused the amount of ozone in the stratosphere to decline over past decades. The declining ozone meant less solar radiation was absorbed, so the stratosphere cooled down. It has also led to an increase in harmful ultraviolet radiation from the Sun reaching the surface. Concern about the damage to the ozone layer led to international regulations on the emissions of CFCs and other ozone-depleting substances, starting with the Montreal Protocol in 1989. Now the ozone layer is beginning to show signs of recovery.

So it is ozone, not carbon dioxide, that has been the main driver of lower stratospheric cooling since 1979. The flattening out of the stratospheric cooling trend is because ozone levels have stopped declining.

A delicate balance for the future

Does that mean that, as the ozone layer recovers, we should expect the lower stratosphere to warm up again in the future? In fact it’s a little more complicated than that. Although carbon dioxide isn’t the main cause of past stratospheric cooling, if we keep emitting it at an accelerating rate its effects will start to become more important. In the future we might see carbon dioxide becoming a major influence on the temperature of the lower stratosphere.

Although we know that carbon dioxide causes stratospheric cooling and ozone causes stratospheric warming, the size of their effects is very complicated to calculate. It depends not just on the effects of these substances on radiation but on complex interactions with the atmospheric circulation, and in the case of ozone is also heavily dependent on complex chemical reactions.

This means climate model projections simulate a broad range of possible future temperature trends. The figure shows differences in lower-stratospheric temperature relative to the 1990s in simulations with 8 climate models including the detailed descriptions of changing stratospheric chemistry that are required to accurately simulate changes in ozone. The black bars show the combined effects of both greenhouse gases (mainly carbon dioxide) and ozone-depleting substances (mainly CFCs). The coloured bars show their individual contributions. The simulations show ozone-depleting substances were the main drivers of past stratospheric cooling. In the future the models simulate a large range of influences.

What all this means is that the future of lower stratospheric temperature will be determined by a tug-of-war between the warming influence of recovering ozone and the cooling influence of increasing carbon dioxide. It is actually difficult to work out which of these effects will win out. It’s even possible they could cancel each other out and the period of constant lower-stratospheric temperatures could continue for decades. In contrast, the period of flat surface temperatures is likely to end in the next few years, and we are very confident it will end with a period of warming (likely accelerated warming as heat is transferred from the oceans to the atmosphere).


Ferraro AJ, M Collins and FH Lambert (2015), A hiatus in the stratosphere?, Nature Clim. Change 5 497-498, doi:10.1038/nclimate2624.


Leave a comment

Stratospheric aerosol geoengineering and the polar vortex

Geoengineering by reducing the amount of solar radiation the Earth absorbs has become a hot topic in the last few years. Of all the impacts geoengineering might have on our climate, why on earth should we care about what goes on in the stratosphere, 10 kilometres above our heads? It turns out what goes on up there has a substantial impact on what goes on down here.

This is the subject of the final paper (open access!) from my PhD work with Andrew Charlton-Perez and Ellie Highwood, at the University of Reading. In it we ask what effect stratospheric aerosol geoengineering might have on the stratosphere, and how those effects might be communicated to the troposphere below.

We used some idealised simulations with a climate model to investigate, placing a layer of aerosol in the model’s stratosphere. Since we don’t know exactly how geoengineering might turn out, we had to make some simplifying assumptions about the size of the aerosol particles and the shape of the aerosol cloud. Not all of these were realistic, so it’s important to think about how our results might be affected if these assumptions changed. That’s a rule that holds true for all science, of course.

ferraro2015_fig4

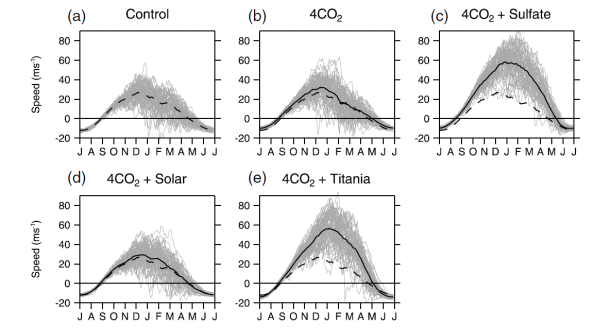
Strength of the polar vortex as measured by winds at 60N, 10 hPa. Each grey line shows the wind speed over 1 year. The mean of the Control simulation is shown by the dashed black lines. The means from the other simulations are shown by solid black lines.

In our model simulations we compared three different potential deployments of geoengineering. One used sulphate aerosol, mimicking the effect of natural sulphate aerosols produced by volcanic eruptions. Another used titania (titanium dioxide) aerosol, which is much more reflective than sulphate and may do less damage to the ozone layer. Finally, we looked at the case where geoengineering was represented by simply dimming the Sun. In practice this could only be achieved using mirrors placed in space, but it has also been used as a representation of geoengineering with stratospheric aerosols.

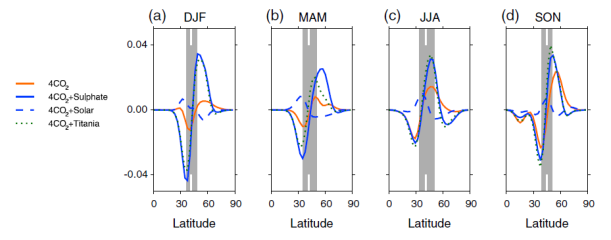
We found that the aerosols intensified the stratospheric polar vortex by warming the tropical stratosphere. The polar vortex is linked to the midlatitude jet streams in the troposphere, which act as guides for weather systems. As the polar vortex gets stronger the jet streams tend to shift further poleward. This would obviously have an effect on the meteorology of a geoengineered world. The jet streams would still wobble and meander about all over the place, but on average they would be located closer to the poles, changing which regions experience the strongest storms and most rainfall.

The link between the stratospheric polar vortex and the jet streams is extremely well documented, and reproduced by models. There is, however, still quite a lot of debate over exactly how the two things are linked, and the extent to which models get it right. For example, the polar vortex intensifies in response to volcanic eruptions, just like it does in simulations of geoengineering, but climate models don’t simulate very well the shifting of the jet streams associated with it.

ferraro2015_fig5

Changes in probability density function of North Atlantic jet latitude in (a) December-January-February, (b) March-April-May, (c) June-July-August, and (d) September-October-November. Grey shading shows the interquartile range of the Control simulation with the median marked with a white bar.

That said, the shifting of the jet streams under stratospheric aerosol geoengineering should be fairly robust. Stratospheric aerosols are known to intensify the polar vortex. This is because they absorb thermal radiation in the tropics (where they get energy from the warm troposphere below) more than they do at the poles (where the underlying troposphere is colder). This temperature gradient sets up a pressure gradient, intensifying the westerly winds of the polar vortex.

The jet streams will shift in response to this, although exactly how, or how much, is open to question. Those are the questions that are more important to answer.

Unfortunately, our study can’t really help with that, for two main reasons.

The first is that we used a single climate model, which means we can’t generalise our results. In order to test the robustness of our results, we would need to look at a number of different models, with different representations of the dynamics of the atmosphere. We also didn’t delve deeply into the theory behind the linkage between the polar vortex and the jets. This is because the science of stratosphere-troposphere coupling is still rather mysterious, and attempting to come up with a theory explaining it is a huge task.

The second reason we can’t use our results to make predictions is that our representation of geoengineering wasn’t particularly realistic. We placed a huge amount of aerosol into the model. In our set up we could put as much in as we wanted because the aerosol particles don’t interact with the atmospheric circulation, or each other. In model simulations where these interactions are allowed, large aerosol injections caused the aerosols to stick together, grow, and fall out of the stratosphere rather quickly. This means it might not even be possible to put such huge amounts of aerosol into the stratosphere.

Whether it would be or not would depend on the degree to which the aerosols stick together. This process would occur differently for different aerosols. For example, sulphate aerosols are liquid and coagulate quite easily. Titania is a solid ‘dust’-type aerosol, which might be more resistant to this. More research is needed on this, though. As far as I am aware no one has done any simulations of how titania might actually behave in the stratosphere.

Another important caveat to our results is that our model didn’t include the effects of the aerosol on stratospheric ozone. As well as it’s important role in blocking UV radiation, ozone affects stratospheric temperatures. Other studies have shown stratospheric aerosol geoengineering would reduce ozone at higher latitudes, cooling the polar stratosphere. This effect would further enhance the intensification of the polar vortices.

So there are a number of reasons we should take care in interpreting our results. The central message, though, is that stratospheric aerosols influence the midlatitude jets, and they do this via polar vortex changes caused by absorption of radiation by the aerosol particles. If an aerosol that didn’t absorb as much was used these effects could be reduced. This is one of the reasons titania is being investigated as a geoengineering aerosol. Titania reflects more radiation than sulphate and absorbs less, meaning one could accomplish the same surface cooling with less aerosol, and have a smaller impact on the midlatitude jets. If we found an aerosol that didn’t absorb radiation at all (not really likely) we would essentially have a very similar case to our solar dimming simulation, which shows very minimal jet shifts.

Finally, it’s important to emphasise this is all hypothetical. I see research like this as part of an effort to understand what stratospheric aerosol geoengineering is. What are the potential risks as well as the potential benefits? This is the first step in understanding geoengineering as a policy option, but it is not the last. There are plenty of potential problems with geoengineering to do with issues of justice, conflict and ultimately, the human relationship with the natural world.


2 Comments

EUMETSAT Conference 2014: Final highlights

2014-09-27 11.27.13

Headquarters of the WMO, which we visited during the conference for a discussion on the socioeconomic benefits of meteorological satellites.

The EUMETSAT Meteorological Satellites Conference 2014 featured a lot of new science. Two particular points which stood out to me was the assimilation of new products into numerical weather forecasting systems, and the use of satellite data in improving our conceptual understanding of weather systems.

Until this conference I was not aware how new it was to incorporate soil moisture into numerical weather forecasting systems. Such forecasting systems spend a good deal of resources on assimilating observational data to initialise the forecast. This is very important because, as pioneering work by Ed Lorenz showed back in the 1960s, tiny differences in the initial state of an atmospheric model (and of course the real atmosphere) can lead to huge differences in the resulting forecast, even for relatively short-range forecasts.

Soil moisture is clearly a useful thing to know about in our forecasts. For weather forecasts it mainly plays a role in supplying water for weather systems. Wet surfaces supply water to the atmosphere, causing or intensifying rainfall.

A few years ago soil moisture satellite products were not considered mature enough to assimilate into weather forecast systems. This is partly because our measurements were quite uncertain (we couldn’t attach very accurate numbers to them), but also because our uncertainty was poorly characterised (we didn’t know how accurate our measurements were). In a sense, the latter is more important. Like much of science, the point is not always knowing things exactly, but accepting that it’s impossible to achieve perfect accuracy and to at least know exactly how certain we are about a measurement (Tamsin Edwards has a related blog post focusing on climate rather than weather).

After some experimental studies showed the potential for soil moisture data to improve weather forecasts, operational forecasting centres across the world began to adopt this extra data source – the ones I heard about at the conference were ECMWF and the UK Met Office, but there are probably others.

Now let’s move to something less mathematical, but equally as important and exciting. On Thursday I listened to two excellent presentations on the Conceptual Models for the Southern Hemisphere (CM4SH) project. The rationale behind CM4SH is that the vast majority of weather forecasting ‘wisdom’ is derived from Northern Hemisphere perspectives, through an accident of history. But understanding the weather of the Southern Hemisphere isn’t as simple as flipping everything upside down. Although the physics of the weather is clearly the same, the actual meteorological situation in Southern Hemisphere countries is different. For example, South Africa lies in the midlatitude belt like Europe does, but it sits rather closer towards the Equator, so the same weather system could have different effects. The configuration of Southern Hemisphere land masses is very different, and that leads to rather different weather behaviour.

CM4SH is a collaboration between the national meteorological services of South Africa, Argentina, Australia and Brazil. The work focused on building up a catalogue of typical meteorological situations in different regions of the Southern Hemisphere, analysing similarities and differences. The international CM4SH team used Google Drive to build a catalogue of these situations, their typical causes, behaviour and effects. Satellite imagery is obviously a major part of the catalogue, as it allows forecasters to track the flow of moisture, presence of clouds, direction and strength of winds. The resulting catalogue allows Southern Hemisphere forecasters to classify meteorological situations and quickly find out the typical effects of different systems. For example, if a forecaster sees a particular meteorological configuration, they can quickly check the catalogue for the effects of similar situations in the past, and see that they need to assess the risk of, say, flooding, in a vulnerable region.

I think projects like this reflect the power of the Internet to supercharge our science. Earlier this week I wrote about how the data from the new GPM mission were available and easily accessible within weeks. GPM is a huge international collaboration combining the resources of a whole constellation of satellites. CM4SH is a project which makes use of expertise from four national meteorological services to create an unprecedented collaborative resource for forecaster training and education, freely available. The CM4SH catalogue will grow over time and become more refined – the beauty of collaborative projects like this is that, as long as someone does a little pruning now and then, they can only ever become more useful.

EUMETSAT Post 1: Challenges and advances in satellite measurement

EUMETSAT Post 2: Socioeconomic benefits of meteorological satellites


2 Comments

EUMETSAT Conference 2014: Socioeconomic benefits of meteorological satellites

Globally, governments spend about $10 billion on meteorological satellites every year. That’s a lot of money. How do we know it’s worth it?

Yesterday night the EUMETSAT conference branched off to the WMO for a side-event asking that very question. I was impressed by the rigour of their calculations, but also by the thoughtful responses to the question of how this information should – and should not – be used.

Alain Ratier, Director of EUMETSAT, presented the results of a comprehensive activity aiming at calculating the benefit-cost ratio to the EU of polar-orbiting meteorological satellites. The cost of these things is relatively easy to estimate, but the benefits are a little more difficult. They approached the problem in two steps: first, what is the economic benefit derived from weather forecasts? Second, what impact do meteorological satellites have on weather forecast skill?

The resulting report contains some fascinating facts and figures. It has been estimated that as much as one third of the EU’s GDP is ‘weather-sensitive’. Of course, this isn’t the same as ‘weather forecast sensitive’, but it at least gives a sense of potential vulnerability. The report concluded that the total benefit of weather forecasts to the EU was just over €60 billion per year. Most of that comes in the form of ‘added value to the European economy’ (broadly, use of weather information to help manage transport networks, electricity generation, agricultural activities, and so on), but there are also contributions from protection of property and the value of private use by citizens.

Compared to the calculation of the economic benefits of weather forecasts, the calculation of the effects of satellite data on those forecasts is quite straightforward. One can assess this by ‘suppressing’ source of data in our weather forecasts. Forecasts proceed by using a numerical model of atmospheric physics to predict the future atmospheric state. Since weather prediction is a chaotic problem, it’s important we start the forecast from as close as possible a representation of the real atmospheric state. This is called initialisation and it’s absolutely crucial to weather forecasting.  In order to calculate the effects of satellite information, we can simply exclude satellites from the initialisation phase of the weather prediction.

(left) 5-day forecast for Superstorm Sandy, (middle) the forecast without polar-orbiting satellite data and (right) the actual conditions that occurred. Credit: ECMWF.

The results are quite astounding. Satellite data contributes 64% of the effect of initialisation in improving 24-hour forecasts (the other 36% comes from in-situ observations). This approach reveals that measurements from a single satellite, the EUMETSAT MetOp-A, accounts for nearly 25% of all the improvement in 24-hour forecast accuracy derived from observations. MetOp-A is a relatively new platform, indicating that recent advances are providing huge benefits to weather forecasts.

The impact of satellite observations is vividly illustrated by considering 5-day forecasts of the track of Superstorm Sandy made with and without satellite initialisation. Without the use of polar-orbiting satellites, forecasters would not have predicted that the storm would make landfall on the Western US coast. As it was, the 5-day forecast of the storm track was remarkably close to reality, allowing forecasters to issue warnings of imminent risk of high winds and flooding.

The conclusion is that meteorological satellites provide benefits that outweigh their costs by a factor of 20. This is a conservative estimate in which high-end cost estimates have been compared with low-end benefit estimates. One reason we might expect benefit estimates to be low is that private companies are often reluctant to reveal how they use weather forecasts, either because this information is commercially sensitive or because they risk being charged more for the forecast data they receive!

It’s important to consider the limits of this approach. The obvious one is that cost-benefit estimates do not include the number of human lives that have been saved by weather forecasts. Not only is this difficult to calculate, it’s also impossible to put an economic value to. It would be very interesting to see if the toolbox of social science research has some methods to assess the ‘social’ part of the ‘socioeconomic’ benefits, moving away from attaching monetary value to things and considering those benefits which aren’t as easy to quantify. This doesn’t have to mean human life; any non-monetary social benefit of weather forecasting could be considered.

I think this is especially valuable because it’s questionable whether the cost-benefit approach is truly appropriate. Cost-benefit analyses frame things in a certain way; the WMO and EUMETSAT representatives at the meeting were well aware of this. They may imply greater certainty than is appropriate, and they may encourage a naively quantitative approach to what is fundamentally a qualitative problem: is it for better or for worse that we have meteorological satellites? Answering such a question involves some value judgements simple quantitative approach can gloss over. As LP Riishøjgaard pointed out, although we can make this kind of cost-benefit estimate ‘frighteningly’ easily, it’s not obvious that we should.

EUMETSAT Post 1: Challenges and advances in satellite measurement.

EUMETSAT Post 3: Final highlights.


2 Comments

EUMETSAT Conference 2014: Challenges and advances in satellite measurement

Atmospheric measurement is an extraordinarily difficult problem. It’s a fluid capable of remarkable feats of contortion, and it contains a number of important constituents, including one – water – which flits easily between solid, liquid and gaseous forms. Satellite instruments offer a unique way to measure the state of the atmosphere, viewing broad swaths of the planet from space.

I’m at the EUMETSAT Meteorological Satellites Conference in Geneva, which is as good a place as any to understand what a remarkable achievement this is. These are my highlights from the first two days, and reflect my particular interests, so I have probably missed a host of other interesting scientific advances.

A major theme of the ‘climate’ session at the conference was the problem of generating long-term climate records from satellite data that is often very choppy. Satellites and their instruments can have very short lifetimes, usually just a few years, though some (like the rather venerable 17-year-old TRMM) buck the trend. Satellites can only carry so much fuel to keep them in orbit, and their instrumentation gradually degrades over time in the harsh environment of space. To maintain a long-term record, you would want to send up identical instruments into identical orbits – but in reality this is not possible. The instruments themselves are made with extraordinary levels of precision, but their complex and delicate nature means it’s not actually possible to make them identical. They will usually have slightly different sensitivies. The satellites carrying them will have different orbits, which means they might measure different parts of the Earth at different times.

Changes like this can cause major stability problems for satellite records. Each time a new instrument goes up on a new satellite the record tends to ‘jump’. Common reasons for this include slight differences in the sensor’s sensitivity, and sampling changes due to the different orbit. As an example, rainfall in the Tropics usually peaks in the afternoon. If you send up a new instrument which passes over the Equator in the morning, it will look like rainfall has abruptly decreased compared to one that passes in the afternoon, but all that’s happened is that you’re measuring it at a different time. These so-called ‘inhomogeneities’ need correction if we are to stand a chance of using these records for studies of climate (which is the statistics of the atmosphere and oceans over decades – many satellite lifetimes).

The ‘climate’ session at EUMETSAT highlighted many approaches to such problems. There was also discussion of the potential for improving the physical consistency between datasets, so common ‘budgets’ can be closed. However, the fact that our observations sometimes don’t ‘add up’ is an important piece of information. It means we’re getting something wrong – but exactly what is of course a rather difficult question.

On Tuesday afternoon a session on precipitation measurement included some very impressive results from the new Global Precipitation Measurement (GPM) mission. A number of technological advances, combined with a unique approach of using two reference satellites to calibrate the measurements from a ‘constellation’ of 11 others, now provide unprecedented detail on Earth’s rain and snowfall. High-frequency microwave measurements combined with radar allow us to look at the icy parts of clouds and to see areas where even very light rain is falling. This allows us to look at, for example, tropical storms in a whole new light – and most importantly, because it’s based on such a huge array of measurement platforms, we won’t miss a single one.

Another impressive aspect of the GPM mission is the speed with which things have moved. Since its launch in February 2014 GPM has been providing huge streams of data, which an international team has worked on to convert to precipitation measurements. Within a short time the data were available to the public. The data were available to the world’s major weather forecasting centres within 2 weeks, allowing them to get a much better picture of the current state of the atmosphere (this is important because small errors in the initial state of the atmosphere can lead to large errors in a weather forecast). In short, GPM looks like a thoroughly modern measurement misson: an international collaboration, operating openly and with detailed documentation, providing timely and freely-available data. Plus it produces some cool graphics (see below).

One of the first storms observed by the NASA/JAXA GPM Core Observatory on March 17, 2014, in the eastern United States revealed a full range of precipitation, from rain to snow. Image Credit: NASA/JAXA

The day closed with a visit to the headquarters of the World Meteorological Organisation for presentations and discussions on the socioeconomic value of satellite data – that’s covered in another post.

EUMETSAT Post 2: Socioeconomic benefits of meteorological satellites. 

EUMETSAT Post 3: Final highlights.


2 Comments

Transformational Climate Science – the future of climate research

On 15-16 May a diverse group of climate researchers gathered at the University of Exeter to discuss the state of climate change following the publication of the IPCC Fifth Assessment Report and the future of the field. In a previous post I discussed some of the key themes. Here I’m going to summarise some of what went on at the conference in terms of how we should proceed with climate research in the future. It will be biased towards physical science, since that’s my personal area of interest.

What are the outstanding challenges in climate research? What are the areas that need further investigation? Should the IPCC process function as a driver for new research efforts?

Science & policy panell (left to right): Thomas Stocker, Saffron O’Neill, Georgina Mace, Andrea Tilche, Asuncion St Clair, Chris Field. Credit: University of Exeter via Flickr.

I think the final question there is an especially interesting one. The role of the IPCC is to bring together diverse research findings and assess our state of knowledge. And yet, sometimes it is seen as an end in itself. One of the speakers at the conference noted he sometimes sees research justified as ‘important for the IPCC assessment’, and that this is a big turn-off. If that’s the best thing the researcher can say about their work it’s probably not going to be that interesting. Of course, it might be that the research is fascinating and yields new insight into some of the big challenges of contemporary climate science. In that case the authors should say so. The challenges of contemporary climate science are not challenges because the IPCC says so; they are challenges because there are scientific and policy questions that need answering. Thomas Stocker, in his remarks, noted that one of the most important things to do in future climate research is to continue with ‘curiosity-driven research’. There are many examples of pure research that did not have any obvious application spawning major advances, often with great commercial success.

I’m no science policy scholar, so I won’t discuss where the balance should lie between ‘pure’ and ‘applied’ research, but this conference provided some food for thought. Some speakers emphasised both equally, generating a tension which isn’t easily resolved. Indeed, the majority of the ‘challenges’ identified at the meeting fell on the ‘applied’ side in the sense that they were suggestions to make climate research more policy-relevant. Perhaps that is unsurprising at a meeting structured around the IPCC, with its strong emphasis on policy-relevance.

One of the main challenges identified during the meeting was moving from the robust aspects of climate theory to those phenomena which actually matter to people on the ground. Robust aspects of climate theory are largely thermodynamically driven, argued Stephen Belcher. We understand that the accumulating energy balance of the Earth will lead to warming, and that the land will warm faster than the ocean. We understand that surface warming leads to greater evaporation and consequently, on average, greater precipitation. But the things we really care about are rather smaller in scale. We experience climate through weather events, and these are influenced as much by dynamic as thermodynamic factors. Unfortunately, we have much less confidence in our understanding of these dynamical processes. They have smaller spatial scales and shorter temporal scales, and so they are much more computationally demanding to model. They involve processes which are not well understood. Ted Shepherd has spoken similarly about the need to focus on the climate dynamics of global warming. It certainly seems like a fertile area for future research, though also a very challenging one.

On the subject of things that people actually care about, Mat Collins and David Stephenson both discussed moving from simplistic averages to the broader statistics of climate. We experience climate through weather, and we care about it most of all when it’s extreme. It’s the ‘tails’ of the probability distribution of weather events that we care about. Unfortunately, said Mat Collins, we don’t really have a good idea about how to assess this. Our current batch of climate model simulations are a statistically questionable sample – they have known deficiencies, biases and interdependencies. We need to address this or develop techniques to deal with it.

On the theme of translating our physical understanding into more relevant information, there was also some discussion of modelling of the politico-economic systems. Integrated Assessment Models attempt to do this, but there is no coordinated intercomparison of these models like there is for climate models. Some at the meeting objected, saying we don’t have good enough theory to be able to credibly model economics. Perhaps that’s true, but just because something is complicated and uncertain doesn’t mean we shouldn’t try to model it; in fact, perhaps it means we should! An intercomparison would at least help us know where we stand.

A final note: this continued emphasis on relevance seems to me to require a greater role of values in presenting stories about what humans care about. Simon Caney spoke about the major breakthrough of including ethicists and philosophers in WG3. More broadly, I think a move to greater policy-relevance would need everyone involved to be crystal clear about what is factual and what it normative (value-based). People were mostly good at that in this meeting. A productive discussion on climate change needs good-quality factual basis and a wide range of normative viewpoints. There was even some discussion about how it might required new forms of collaborative decision-making.

Regardless, the very necessary shift towards policy relevance will mean the potential for even greater controversies. Sam Fankhauser spoke about the need to develop very clear channels for communication to help get around this: ‘whatever we say will be used in that very emotional debate’. It’s difficult and sometimes downright unpleasant, but I think ultimately we have to embrace that.

claimtoken-5385ae663679f


3 Comments

Transformational Climate Science – approaching the problem of climate change

On 15-16 May a diverse group of climate researchers gathered at the University of Exeter to discuss the state of climate change following the publication of the IPCC Fifth Assessment Report and the future of the field. In a previous post I discussed some of the key themes. Here I’m going to summarise some of what went on at the conference in terms of how we should approach climate change.

How does the IPCC work? Is climate research doing what it should? Should it change?

Chris Field presents an overview of the AR5 WG2 report. Credit: University of Exeter via Flickr.

The Transformational Climate Science meeting had sessions structured around the three IPCC working groups (The Physical Science Basis; Impacts, Adaptation and Vulnerability; Mitigation of Climate Change). However, the IPCC is not the bottom line in climate research. It’s important to remember that its main role is to summarise our state of knowledge rather than to do new research (though it does do this as well to some extent). However, the IPCC remains a convenient ‘hook’ on which to hang our deliberations about climate change, which is presumably why the meeting was structured as it was.

As a physical scientist, I was looking forward to learning about working groups 2 and 3. Working Groups 2 and 3 (WG2 & WG3) bring together an astonishingly broad group of people: physical scientists, economists, sociologists, political scientists, philosophers…I got the impression the level of ‘cohesion’ was a little lower in these working groups than WG1. In WG1 everyone has different specialisms, but participants probably understand each others’ way of thinking well, whereas I don’t think that would be the case for people coming from diverse cognitive traditions in WG2 and WG3.

Aside from the need to bring together people with different expertise to cover the subject matter, there’s another benefit to this diversity. In the meeting a number of IPCC authors acknowledged their work could not be completely free of value judgements. By bringing together a diverse group of people, the hope is that at last a range of different value systems can be considered. A number of authors also made it explicit when they were trying to be objective and reporting ‘IPCC opinion’, and when they were talking about their own personal opinion.

One of the challenges faced by the authors of the WG2 report was the tendency of negative impacts of climate change to be reported more than positive ones. Sari Kovats, in her remarks, explicitly noted this and pointed out this was something authors were aware of and attempted to deal with as best they could. She also described what she saw as the problems in writing a report with limited quantitative research. She gave the example of the Russian heatwave and wildfires of 2010. We do not have a good idea of the impacts of this event on human health, economic productivity or food supply. In short, we lack good data. This problem becomes worse in less developed countries, which is understandable but frustrating since we might also expect such countries to be more vulnerable to climate risks.

I thought Sari’s presentation was one of the most interesting at the meeting. It described nicely what the state of the art is when it comes to studying climate impacts. She described the challenges of interpreting small-scale qualitative studies with the goal of drawing conclusions for quantitative assessments of climate risk. Then she outlined what she thought WG2 did well and what she thought it didn’t. This includes the problem that less developed countries do not have the demographic and health data needed to assess climate impacts, and that the report did much better at describing regional inequalities in impacts than it did the socioeconomic inequalities. In a globalised world, perhaps socioeconomic divides are as important as geographical ones.

Chris Field gave some thoughts on the role of WG2. He saw it as a prompt for discussion of publicly acceptable solutions – the start of a dialogue rather than its end. I found this extremely encouraging, and in line with previous discussions of the importance of considering the value systems of different stakeholders.

I admit to finding this surprising. I had rather lazily assumed that IPCC reports didn’t include discussion of normative aspects of climate science and policy. It was encouraging to see Simon Caney talk specifically about this point. For the first time the WG3 report included a section on ethics. He pointed out that ‘dangerous’ is a value judgement, and it was vitally important to consider peoples’ values. He gave the example of people who say ‘we should do whatever it takes to tackle climate change’. They almost certainly don’t mean that. Caney pointed out that different people have different priorities, but that it was unlikely anyone genuinely things climate change is the only priority.

Such perspectives are very valuable. Caney also brought in the view that the ‘right to emit’ is an odd concept. What matters for people is the access to energy to enable them to fulfil their requirements. He argued that Amartya Sen’s perspective on serving capabilities was more relevant than considering every person’s equal right to emit greenhouse gases. The emissions are a side-effect of the requirement for energy, and we should view responses to climate change in terms of serving capabilities rather than picking out such a side-effect.

One final thought – Saffron O’Neill pointed out that media coverage of WG1 is greater than either WG2 (one third less) or WG3 (three quarters less). Interestingly, the amount of Twitter activity on the conference hashtag also seemed lower during WG2 and WG3 sessions. It’s interesting to consider why this might be the case. One simple reason might be that the WG1 report is released first. But is there something deeper here? Do we ‘value’ the explicit and factual nature of WG1 more than the difficult, fuzzy, value-laden world of WG3? Perhaps, but I think that’s a shame. It seems especially odd that those who self-identify as ‘sceptics’ focus so much on WG1, when there’s a whole lot more stuff up for legitimate debate in WG2 and WG3.


12 Comments

Transformational Climate Science – meeting report

On 15-16 May 2014, the University of Exeter hosted an impressive array of climate change researchers from across the world. It was a medium-sized conference discussing the state of climate change research across all three working groups of the Intergovernmental Panel on Climate Change, along with goals and challenges for the future.

I found the meeting absolutely fascinating for all manner of reasons, most of which I hope to cover in two following blog posts. This post is something of an introduction.

Conference attendees gathering in the University of Exeter’s Forum. Credit: University of Exeter via Flickr.

One of the most obvious draws for me was that it brought together people from all three IPCC working groups. As a physical scientist I am familiar with the workings and results presented by the first working group, but the other two are rather more mysterious to me. This meeting served as a great summary. In case you’re not aware, the IPCC reports are produced by three separate groups:

These working groups operate rather separately. Once they have all released their reports they are combined in a synthesis report. The synthesis report for the Fifth Assessment goes to governments in October 2014. So, where next?

In the next two blog posts I’m going to discuss two themes which I felt ran through the conference.

The first is: how should we approach climate change? What kind of discussions should we be having, and how should they work? How should decisions be made?

The second is: what is the future of climate research? What information do we need and how can we get that information?

These questions are clearly inter-related. The first question is more of a political one, but the second one is clearly also politically relevant, as ultimately the choice of what information we need lies with policymakers and the public. This is one of the over-arching topics which transcended both of the themes: that climate research and policymaking is a mixture of facts and values. In simple terms: it is a fact that the planet has warmed, will continue to warm to a greater or lesser degree, and that this warming will have impacts. However, what we do about it (or indeed whether we do anything about it) is a question of values. It is a normative question in which there is no single right answer.

Even though facts might be seen as ‘valueless’, many of the speakers at the meeting argued there was no such thing. Asuncion St Clair quoted Bruno Latour: ‘no knowledge is neutral’. The way facts are presented requires the imposition of some kind of value system. Ottmar Edendorfer said at the conference that he sees the role of the IPCC as akin to that of a map-maker. The map-maker doesn’t tell the user which route to take. The map-maker examines the landscape and maps out the features, obstacles and characteristics of all paths. And yet the map-maker can’t just present the ‘facts’. The choice of what goes on the map depends on what the map-maker thinks the user needs. Take, for example, the difference between political and topographic maps. One presents largely artificial boundaries between nation-states; the other presents details of the landscape. Which one you choose would depend on your needs.

Even though it’s not possible to be completely neutral, then, perhaps the IPCC could try to address this problem by providing as much information as possible. Of course, this doesn’t make it very readable and that’s why there are two summaries that attempt to make the make points easier to grasp: the Summary for Policymakers (the content of which has to be agreed to by governments) and a Technical Summary (which doesn’t). But the choice of what goes in there might also be normative.

Given its stated goal to be ‘policy relevant, not policy prescriptive’, and the enormous complexity of its subject matter, the IPCC often makes very careful statements emphasising precisely what we do and do not know. Chris Field pointed out that this leads to something of a problem. He said that some of the statements turned out so vague that they were open to almost any interpretation. Different media outlets could make very different readings of the report and come to sometimes diametrically opposed conclusions!

This raises the issue of framings. ‘Framing is everything in this debate’ said Georgina Mace. What this means is that, given a more-or-less neutral presentation of information there is no single implication that naturally comes out. The implications of the findings of the IPCC depend on how one views the world. At the meeting Saffron O’Neill presented the results of some of her work on media framing of AR5. Common frames included: ‘settled science’, ‘unsettled science’, ‘security’ and ‘morality and ethics’. She pointed out that different frames implied very different policy options.

In the coming blog posts I hope to draw out some more detail on the two main areas of the conference: how should we approach climate change and what is the future of climate research? After all that talk of framings it’s important to say that these are my personal impressions, and not an objective report. If you want to find out exactly what went on at the meeting, you can catch up on the presentations and panel discussions on the website.

Other coverage: