What determines how much global warming we are going to see? In the long term it all comes down to feedbacks – changes in the climate system in response to warming which act to strengthen or weaken the eventual total warming. I have a new paper out in Journal of Climate with co-authors Hugo Lambert, Mat Collins and Georgina Miles looking at two of the main climate feedbacks in satellite observations and climate models.
One of the main feedbacks is the positive water vapour feedback, which comes about because a warmer atmosphere holds more water vapour, a greenhouse gas, which amplifies the warming. In climate models, a strong positive water vapour feedback is usually associated with a strong negative lapse rate feedback (which arises because the atmosphere warms faster than the surface). This means that models agree more on the size of the combination of these two feedbacks than they do on the size of the individual components.
We can imagine why the water vapour and lapse rate feedbacks would oppose each other. The water vapour feedback happens because atmospheric specific humidity increases with warming. The humidity of the upper troposphere is especially important for controlling the amount of radiation the Earth emits to space. If upper tropospheric humidity increases, the amount of radiation emitted to space goes down and the Earth warms up.
Now, atmospheric humidity is controlled by transfer of water from the surface, so generally any water vapour in the atmosphere must have got there by condensation. Since condensation releases heat, increasing humidity must generally be accompanied by atmospheric warming. This physical picture is especially appropriate for the Tropics, where convective storms provide the main pathway for water to get into the upper troposphere. Isaac Held has a number of posts on this topic on his blog – for example, this introduction to the concept of the moist adiabat. Outside the Tropics convection doesn’t link the upper troposphere so strongly to the surface, so the picture becomes a little more complex.
The question is: do the water vapour and lapse rate feedbacks oppose each other on a regional basis as well as a global basis?

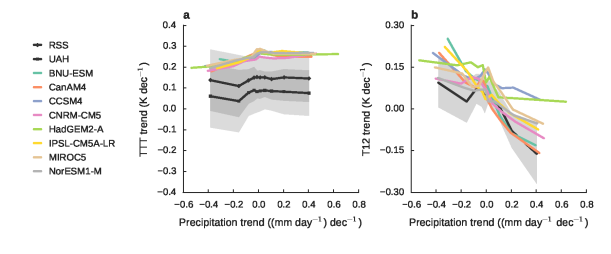
Figure 1. Regional modelled and observed changes in tropical HIRS Channel 12 brightness temperature (a proxy for upper-tropospheric humidity) as a function of precipitation trend.
Observing climate feedbacks
In climate models it is possible to calculate feedbacks quite accurately. This involves running a radiative transfer calculation on the atmospheric properties from a present-day model simulation, then swapping in the atmospheric properties of interest from a warmer climate. For example, for the water vapour feedback we should change just the water vapour content of the atmosphere and use the radiative transfer calculation to look at what it does to the outgoing radiation. This procedure can’t really be done with observations because we can’t observe the warmer climate! There are also complications in working out what the observed atmospheric properties are. Satellites can help, but they measure radiation, not the atmospheric properties directly, so we have to introduce a modelling step to derive them. These so-called ‘retrievals’ can in some cases be very accurate, but the additional calculation introduces some uncertainty into the analysis.
Nevertheless, using this technique we can observe the water vapour feedback associated with year-to-year variations in atmospheric humidity, but we then have to take care drawing links between these variations and the potential feedback associated with long-term global warming. Gordon et al (2013) found that the water vapour feedback in response to short-term variations was less than that in response to long-term global warming.
We took a different approach in our paper. Rather than look at variations in the climate system we looked at 30-year trends over some of our longest-running satellite observations. For upper-tropospheric humidity, we looked at the brightness temperature at a wavelength of about 6.7 microns, as measured by the High-resolution Infrared Sounder (HIRS). This corresponds to the amount of outgoing radiation at the centre of one of the absorption bands of water vapour. For upper-tropospheric temperature, we looked at the microwave emissions as measured by the Microwave Sounding Unit (MSU). Rather than trying to use these data sources to derive the atmospheric properties to compare with climate models, we instead calculated what these observations would look like if climate models were real. One can do this using radiative transfer calculations that have been shown to be quite accurate.
We then looked at the observed changes in these two quantities and compared them with the corresponding changes in climate model simulations. Since we were interested in specifically the behaviour of the atmosphere, we used model simulations in which sea surface temperatures were fixed to observations for the period 1979-2009. This means we can be sure any differences we see among models are to do with the simulation of the atmosphere, not the ocean.
What we found was that the atmospheric warming over the past 30 years has been fairly uniform across the Tropics (Figure 1a). This is because, in this part of the world, the Earth is rotating quite slowly and is unable to maintain strong temperature gradients. To borrow an analogy from Isaac Held, you can think of this as being like a tank of water unable to maintain a higher level in the centre than at the edges. If the tank was rotating it would be able to do so (this is more like the situation near the poles). Recalling that the lapse rate feedback is basically to do with the difference in the rate of warming of the surface and the atmosphere, this means that the regional pattern of the lapse rate feedback would be mainly determined by the regional pattern of the surface temperature changes.
On the other hand, we found that the pattern of changing atmospheric humidity was quite variable (Figure 1b). Unsurprisingly, in the Tropics this is strongly related to precipitation, since the convective storms that moisten the upper troposphere also produce rainfall.
Bringing the evidence together
These two patterns are quite well reproduced among climate models, which is nice to see. They are doing what we physically expect, but this result spawns another question.
Tropical precipitation changes under global warming can be thought of as a combination of two effects. First, a warmer atmosphere holding more water means that convective storms tend to rain more. Second, the pattern of surface warming tends to shift the regions in which convective storms happen. If the water vapour feedback’s regional pattern is related to precipitation, which of these two effects matters more? We used climate model simulations to answer this question to take advantage of the additional detail they provide.
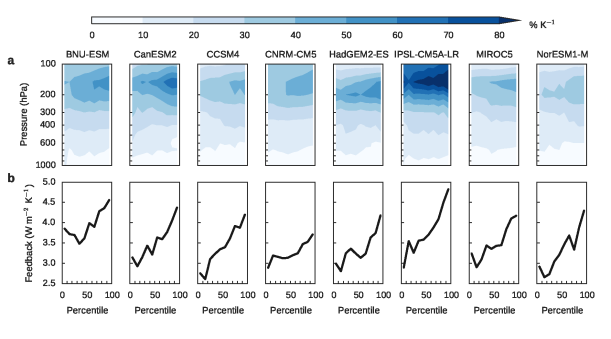
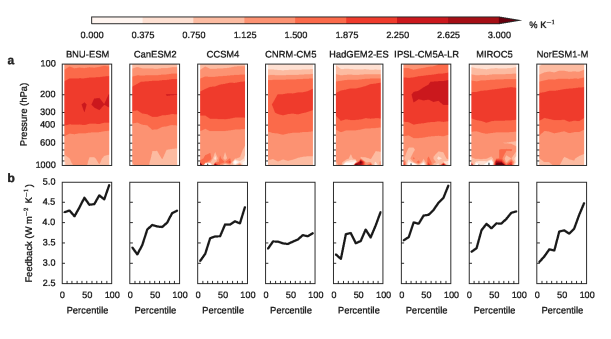
We found that, even when we accounted for the shifting convective storms, the pattern of strong atmospheric humidity increases in the regions of the greatest increases in rainfall persisted. Crucially, after accounting for the shifts, we found there was some relationship between the water vapour and lapse rate feedbacks on a regional scale, just as we saw on the global scale. A strong positive water vapour feedback is associated with a strong negative lapse rate feedback (compare Figure 2b with Figure 3b below).
Now we have a coherent picture emerging. There is no relationship between the water vapour and lapse rate feedbacks on a regional basis, in spite of the relationship on global basis, because atmospheric temperature changes get ‘mixed out’ horizontally much more than humidity changes. However, if we remove the effects of shifting precipitation patterns on the feedbacks, a relationship starts to emerge. The relationship is not strong, indicating the fundamental difference in horizontal mixing is still having an effect, but it is there. Climate models reproduce these patterns in a similar manner to the observations we looked at.

Figure 2. (a) Modelled changes in atmospheric specific humidity in response to a quadrupling of CO2 concentrations. (b) Modelled water vapour feedback. Data are presented in percentiles of precipitation with the regions of heaviest precipitation on the right.

Figure 3. (a) Modelled changes in atmospheric temperature in response to a quadrupling of CO2 concentrations. (b) Modelled lapse rate feedback. Data are presented in percentiles of precipitation with the regions of heaviest precipitation on the right.
These results are not a particularly stringent test of climate models. The relevant physics are quite simple so it would be a huge surprise if they did not behave in this manner. However, our research is still useful because it indicates the models do behave in physically sensible ways and that we can use them to explain the regional distribution of the water vapour and lapse rate feedbacks.
We also asked whether a model’s representation of these feedback patterns tells us anything about the total strength of these feedbacks – in other words, how much global warming we might see for a given increase in carbon dioxide concentrations. Unfortunately, we didn’t see a relationship here. This might be because we only used eight climate models in our investigation, but it might also be that there is no physical link between the two things.
Ferraro AJ, FH Lambert, M Collins and GM Miles (2015), Physical Mechanisms of Tropical Climate Feedbacks Investigated using Temperature and Moisture Trends, J. Clim, doi:10.1175/JCLI-D-15-0253.1.
